


In early 2024, DoorDash faced the challenge of keeping pace with the rapidly evolving demands of global search. To meet these needs, we built an in-house search engine that resulted in a 50% reduction in p99.9 latency and a 75% decrease in hardware costs. New challenges began to surface as more groups adopted it and its size began to scale — inconsistent CPU utilization and sporadic latency spikes in searcher pods. To respond, we opened an investigation into these performance anomalies in an attempt to get to the root of the problems.
Here, we explain how we resolved the issues through both a strategic transition of our Searcher application's garbage collector from Shenandoah to Garbage First Garbage Collector, or G1GC, as well as an upgrade to Apache Lucene version 10.2. In addition to resolving the issues we had encountered, these changes also resulted in significant additional benefits, including reducing hardware costs by an additional 30% and improving p99.9 latency up to 30%. Our experience shows how addressing specific performance issues can lead to substantial platform-wide optimizations.
The problem: High variance in Searcher CPU utilization
The core search functionality is provided by three main services: Indexer, Searcher, and Broker. Each search stack is made up of these three components.
- Indexer service:
- Handles all incoming indexing traffic, such as ingesting and processing documents, and builds index segments.
- Uploads the newly created index segments to S3 for searcher consumption.
- Offers a single logical indexing service that is not replicated
- Scales by splitting indexing traffic into bulk updates that are applied in the next full build cycle, for example every six hours, and high-priority updates that are applied immediately.
- Searcher service:
- Broker service
- Acts as an aggregation or coordination layer above multiple index shards/searchers
- Fans out relevant shards to appropriate searchers as queries come in, then merges or combines the results.
- Applies query rewriting/planning through a query-understanding and planning component that translates the user’s raw query into an appropriate form for retrieving and ranking from shards.
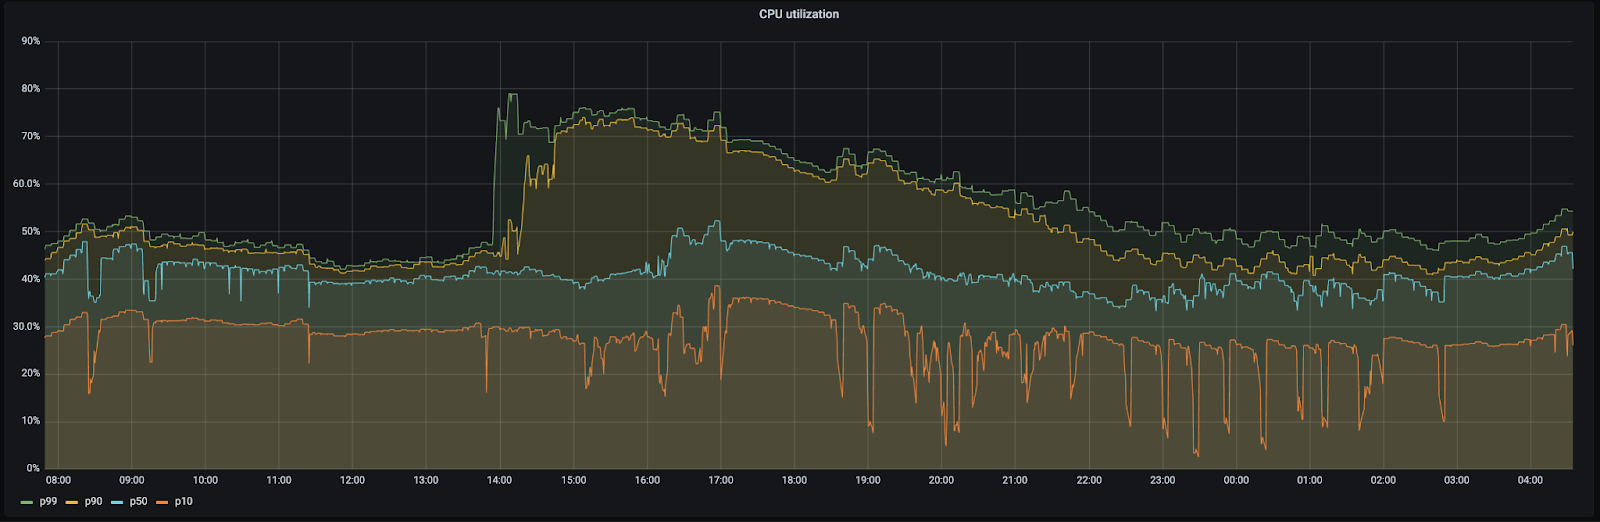
In some of our search stacks, the searcher pods - which read a Lucene index from memory - had high variance in CPU utilizations, with a maximum of 70% and a minimum of 30%. This CPU utilization variance occurred despite the fact that these pods were in the same cluster with the same CPU cores and memory and running the same code. The graph in Figure 1 shows the variance in CPU utilization of searcher pods in one of our stacks:
This issue caused the following performance and operational challenges:
- Inconsistent application performance: The high CPU utilization on some pods led to slower query handling and caused latency spikes, which meant a less reliable experience for our users.
- Inefficient autoscaling: CPU utilization-based autoscaling for the application was ineffective because average utilization across the entire service would be below the threshold even when there were overloaded pods present. We had to reduce our CPU utilization threshold for autoscaling to temporarily mitigate the impact, but this meant that our clusters were underutilized.
- Deployment challenges: The performance variation made our canary analysis for new deployments flaky and unreliable. This led to failed deployments and even required us to disable canary analysis for some services.
Investigation
We initially investigated the issue by attaching debug containers to “good” vs. “bad” pods. Using perf stat, we were then able to see that the Java virtual machine, or JVM, operated at different speeds or instructions per cycle (IPC) on the two pods:
“Bad” pod (2.64 IPC)
root@ip-xx-xx-xx-xx:/home# perf stat -p 20907 -e cache-references,cache-misses,cycles,instructions,branches,faults,migrations,L1-dcache-load-misses,L1-dcache-loads,L1-icache-load-misses,L1-icache-loads,branch-load-misses,branch-loads,dTLB-load-misses,dTLB-loads,iTLB-load-misses,iTLB-loads

^C

 Performance counter stats for process id '20907':

 1,955,807,660,598      cache-references                                              (35.01%)

     7,111,679,015      cache-misses              #    0.364 % of all cache refs      (35.63%)

 1,570,892,007,160      cycles                                                        (42.94%)

 4,145,766,953,469      instructions              #    2.64  insn per cycle           (43.06%)

...
“Good” pod (3.09 IPC)
root@ip-xx-xx-xx-xx:/home# perf stat -p 20944 -e cache-references,cache-misses,cycles,instructions,branches,faults,migrations,L1-dcache-load-misses,L1-dcache-loads,L1-icache-load-misses,L1-icache-loads,branch-load-misses,branch-loads,dTLB-load-misses,dTLB-loads,iTLB-load-misses,iTLB-loads
^C
 Performance counter stats for process id '20944':

 1,310,465,138,386      cache-references                                              (34.96%)
     6,869,104,970      cache-misses              #    0.524 % of all cache refs      (35.52%)
 1,187,720,719,276      cycles                                                        (42.69%)
 3,671,258,915,247      instructions              #    3.09  insn per cycle           (43.21%)
...
We then looked at the flame graph of the workload’s CPU profiles and saw that org.apache.lucene.util.bkd.DocIdsWriter.readInts24 accounted for around 46% of all sampled CPU time. This is one of the internal Lucene functions used by our Searcher application. It was important to compile this function well because it accounted for such a large chunk of the CPU time. We checked the assembly code generated by the just-in-time, or JIT, compiler for this function and saw that we were spending a lot of CPU cycles on memory barriers inserted into the JIT code by Shenandoah GC, which was a necessary part of its concurrent compaction strategy.
Based on this, we tested our application with other garbage collectors. When we switched to G1GC, we saw marked improvements in the performance of that particular stack — around a 70% decrease in latency and a 40% decrease in CPU utilization.
Although G1GC and Shenandoah GC are both low-pause garbage collectors, they take very different approaches:
- G1GC partitions the heap into regions and collects them incrementally. It tries to meet a target pause time by selecting which regions to reclaim — in other words, “garbage first”. But G1 still has stop-the-world (STW) phases for marking and region evacuation, so pause times scale with live data size, albeit much better than older collectors such as Concurrent Mark Sweep.
- Shenandoah GC also uses regions, but its key feature is concurrent evacuation. It moves objects while the application is still running by inserting load/store barriers into JIT-compiled code. This reduces pause times dramatically — often in the single-digit milliseconds, independent of heap size — but comes at a CPU cost because every reference access carries a barrier check.
Our previous Shenandoah GC, while offering low one to two millisecond STW pauses, introduced significant CPU overhead caused by memory barriers in the JIT code. Switching to G1GC provided a better trade-off: 10 to 20 millisecond STW pauses with 35% better CPU utilization. G1GC eliminates memory barriers on hot functions, leading to improved latency and higher CPU efficiency. Consequently, switching to G1GC was a natural choice for us because our application could afford the occasional 10 to 20 ms STW pause without a noticeable degradation in service performance.
We also realized, moreover, that the hot function discovered earlier was highly optimized in the latest version of Lucene, which was version 10. Lucene 10 also came with a set of other performance improvements that helped motivate the migration from Lucene 9.
At this point, our investigation had created two key action items: Switch to G1GC from Shenandoah and upgrade from Lucene 9 to version 10.
Stay Informed with Weekly Updates
Subscribe to our Engineering blog to get regular updates on all the coolest projects our team is working on
Please enter a valid email address.
Thank you for Subscribing!
Results
As a result of switching our Searcher application from Shenandoah to G1GC and upgrading from Lucene 9 to 10.2, we observed material improvements across latency, CPU efficiency, and deployment stability:
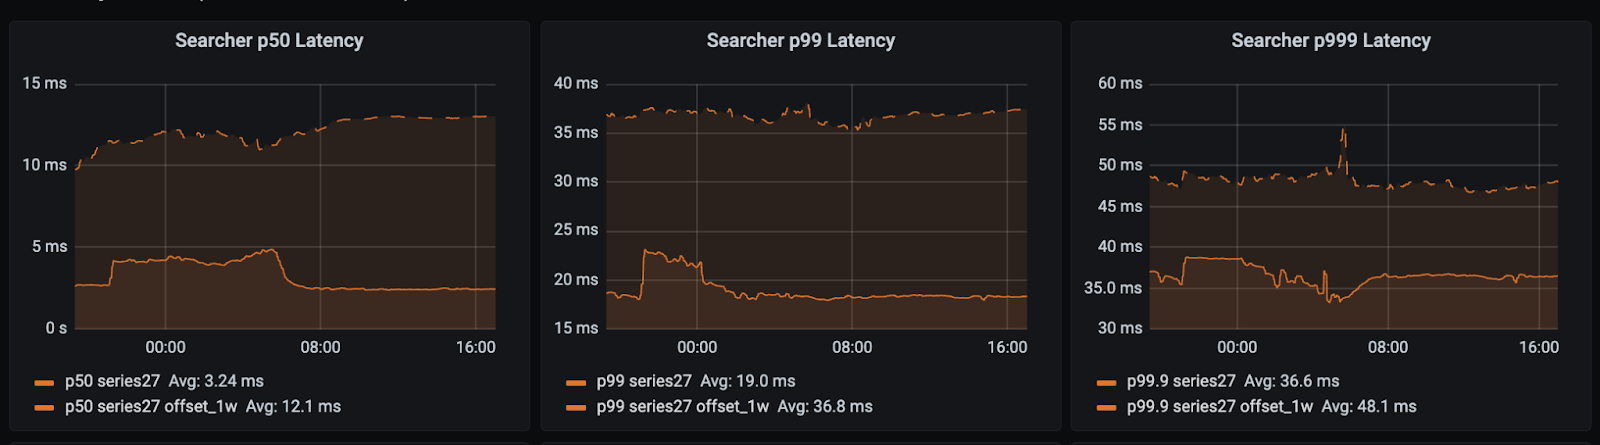
- Latency improvements (as shown in Figure 2):
- p99.9 latency improved up to 30% in production traffic.
- Long-tail outliers caused by “bad” pods disappeared almost entirely, leading to more consistent query response times across the cluster.
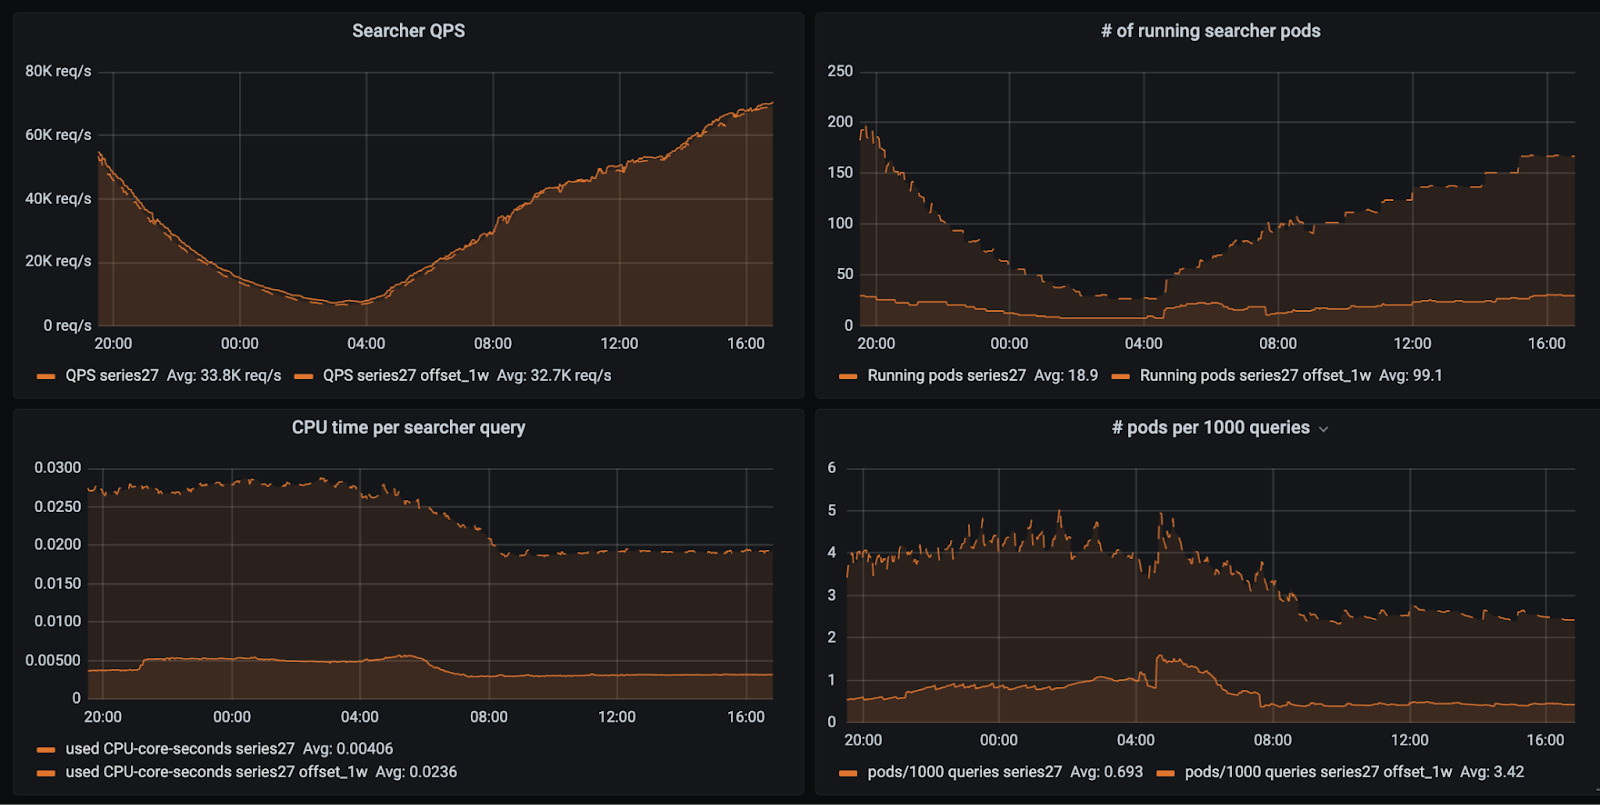
- CPU utilization improvements (as shown in Figure 3):
- Average CPU utilization dropped by 35 to 40% compared to Shenandoah-based runs, resulting in more efficient commute utilization and lower costs.
- Variance between “good” and “bad” pods collapsed. CPU usage across replicas is now tightly distributed, typically within a 5% to 10% band, leading to more efficient CPU utilization-based autoscaling.
Conclusion
This entire investigation was triggered not by a failing average, but by a "noisy" p99.9 latency monitor. It's a powerful reminder that the most critical performance issues often hide in the margins, and investigating outliers is key to building a truly robust system.
The solution wasn't found in our application's business logic, but deep in the platform's core. By moving past surface-level code and profiling the JVM, JIT compiler, and even assembly, we unearthed subtle inefficiencies that together had a massive, cascading impact. Addressing these foundational issues delivered improved performance to every client on our platform, proving that the most impactful optimizations are often the ones closest to the metal.
Since we launched our in-house search engine early last year we’ve onboarded more than 20 different internal teams. Each brings their own data to create a search engine on top of our platform and all have benefited tremendously from these improvements. This shows how platform-level optimizations, often hidden beneath the surface of application code, can deliver outsized efficiency gains when addressed systematically.
Acknowledgements
We’d like to thank Aleksandr Sayko for his mentorship and deep technical insights that guided this project’s direction. Special thanks to Prasad Sriram, Konstantin Shulgin, and Satish Subhashrao Saley for their contributions during the entire process.