


As DoorDash’s web projects became more complex, we took note of a familiar pain: Our continuous integration (CI) pipelines were becoming a serious bottleneck. What used to be quick feedback loops turned into prolonged waits, slowing down developer momentum and driving up engineering costs.
Ultimately, we were able to significantly reduce CI durations, slashing build and test times by 75% — saving more than 500 engineering hours per month. Here we detail our journey to this achievement, exploring our strategies around advanced tooling optimization, strategic open-source contributions, and improved parallelization techniques.
Building for the web
Over the past two years, DoorDash’s Web DevEx team has been migrating users to a new Rush monolithic repository, or monorepo, that now makes up 65% of our web commit volume. Rush is a TypeScript/JavaScript monorepo build tool from Microsoft. This new monorepo is referred to as “web-next,” while we refer to our previous monorepo as simply “web.”
Our team uses Rush and Rushstack extensively, leveraging in particular a feature called cobuilds, which was originally contributed by TikTok. Cobuilds allows builds to be distributed efficiently across multiple CI agents directly within Rush, eliminating the complexity of adopting heavier build orchestration systems such as BuildXL or Bazel remote builds. Each CI agent proactively picks up and executes tasks that are ready — meaning they have no pending dependencies and require active processing.
The largest and most active project in our monorepo is the DoorDash.com website, internally named “consumer-web-next,” or CWN. In 2021, CWN transitioned to a Next.js monolith. Today, that single project makes up 35% of all commits to web-next.
At that scale, build and test times in CI start to become problematic without consistent investment. When CWN migrated into web-next, it took 22 minutes to build and test —11 minutes to build and 11 minutes to run the full suite of tests. Given our workload of more than 400 builds each week, this was a substantial cumulative cost in developer productivity and engineering time.
First steps
During its build steps, Rush conforms to a strong philosophy around Typescript: Compile once. The default plugins for ESLint, Webpack, and Jest use a single compiled Typescript program, which saves substantial time that would otherwise be spent on duplicative work.
Unfortunately, Next.js is not compatible with that approach out of the box. Under the hood, Next.js leverages SWC for its Typescript transpilation, so pre-compiling to JavaScript doesn't significantly reduce build times. We’ve observed that over 90% of our build time for Next.js is spent on Webpack module building and sealing; type checking consumes only around 30 seconds per build.
In the end, we realized that pre-compiling to JS was no longer necessary for our Next.js services. This opened up the opportunity to explore new strategies for speeding up our CI pipeline:
- Running build and test in parallel.
- Sharding the test cases.
Low-hanging fruit
As with most large-scale projects, we started with the low-hanging fruit to achieve rapid improvements, looking in particular at the operation graph and individual phase executions.
Cobuild clusters
Cobuilds are a complex use case for Rush, and there are some non-trivial dependencies on build caching. When a project depends on another project that doesn’t produce build output — or for some reason is uncacheable — cobuilds assign all of those operations to a single cluster. Clusters are built on a single machine because it’s assumed that the uncacheable project has some build output that can’t be shared across machines.
Initially, we anticipated minimal overhead from adopting cobuilds. While this held true overall, clusters unexpectedly emerged as a significant bottleneck. We ran 10 agents to cobuild about 350 projects. Unfortunately, our fundamental packages, which include rigs and a custom ESLint profile, were uncacheable because there was no build step or build output. This caused nearly all of our projects to be clustered, reducing our parallelism to just one or two agents.
To resolve this issue, we contributed an open-source patch to Rush. The root cause was that cobuilds didn’t consider no-ops to be uncacheable, which caused anything without a build script to be clustered automatically. With that fixed, we were able to confidently reduce the number of agents we used down to five, with cobuilds using all of them.
Turning off Next.js Webpack disk cache
Next.js caches Webpack, ESLint, and SWC by default, storing it locally in a directory under .next/cache. For large projects, the Webpack cache can exceed 5 to 10 GB. This, coupled with the fact that we were not saving the cache across CI jobs, meant a lot of disk writes were effectively writing to the void. Disabling the Webpack disk cache eliminated unnecessary disk activity, saving us three minutes in CI runtime.
Decoupling ESLint from Next build
Next.js allows you to run linting as a built-in step. However, this happens late in the Next build process, slowing feedback cycles. By decoupling our linting from that build step, we can run three minutes of linting in parallel with the build, giving developers feedback five minutes faster.
Results
Implementing these three changes decreased CI runtime by six minutes and cut billed minutes for agent usage in half. Despite these improvements, our developers nevertheless were spending 16 minutes waiting for their CI runs to finish. We knew we could improve even more.
Build and test in parallel
Keeping Typescript as the source language means our Next.js build and Jest tests can be built in parallel. But implementing this proved more challenging than initially expected.
To run build and test in parallel, we needed to ensure they wouldn't execute on the same CI agent. Those CI steps are incredibly memory intensive; build requires 12 GB and test requires 20 GB, making it impossible to run them in parallel on the same agent.
Weighted operations
Enter weighted operations. Rush creates a graph of operations based on scripts that are defined in package.json; by default, they all have the same weight of one. Rush also allows running a number of operations in parallel on a single machine, which can significantly speed up builds. To force build and test to run in parallel across agents, we needed a mechanism to prevent an agent from trying to pick up both operations.
Thankfully, Rushstack already has a strong implementation that handles a weight of one correctly. Expanding this feature required a deeper exploration of async iterators.The basic idea here is that we need to:
- Lock the queue.
- Check the weight of the next item in the queue.
- Start it if possible and then unlock the queue.
- Otherwise, unlock the queue and wait to pick something else up.
There are many re-entrancy concerns because the use case for this is the core orchestration engine in Rush. We need to make sure that:
- We don’t allow multiple operations to enter at once.
- We respect the weight of an operation at all times.
- We don’t leak operations’ weights onto the queue/locking mechanism.
So, how do we accomplish this?
Semaphores
Because this is only Promise-level locking, we need to figure out the right location to prevent Node.js from allowing multiple tasks through. Node.js being single-threaded makes reasoning here easier – just look for the async/awaits. During execution, Node.js will yield execution back to the task queue on an await. For I/O bound tasks that use events, this frees up the Node scheduler to run other tasks. As a rule of thumb, Node will not yield execution if everything is synchronous. For an async iterator, if everything is synchronous, that means a parallelism factor of one. To achieve actual parallelism, we need to integrate async/await fully.
It is relatively straightforward to integrate weight with an asynchronous semaphore. The big issue here is discovering the weight of the operation that we want to pop off the queue. By their nature, JavaScript iterators cannot peek at the next item in the queue, so we must be confident that we can handle the next operation before we determine its weight.
The simplest way to handle this is to completely deplete our semaphore. For example, we allow four tasks to run in parallel and try to pick up an operation with weight three. The only way that we can know the weight of the operation is to start work on it, so we would need to ensure that no other entrants are allowed to do the same. Simultaneously, we still want to run with as much parallelism as possible, so we release unused resources back to the semaphore. In our example, we would return the one remaining weight back to the semaphore.
Results
By running build and test in parallel, we halve the time in CI down to 11 minutes. That’s a huge improvement, but we can still do better. At this point in our journey, we had reduced our build time to six minutes, making the test phase our new bottleneck.
Stay Informed with Weekly Updates
Subscribe to our Engineering blog to get regular updates on all the coolest projects our team is working on
Please enter a valid email address.
Thank you for Subscribing!
Sharding test cases
Jest provides two scaling strategies:
- Scale vertically using maxWorkers to run more test cases on the same machine in parallel.
- Scale horizontally using shards to run test cases across machines in parallel.
We had already maximized vertical scaling with eight workers per machine. As our test suites grew, we began encountering memory errors, making horizontal scaling — sharding — necessary. While we could manually shard our phases for Rush, the overhead of maintaining those shards and the extra structural nodes that would show up for our users was unacceptable. So we started an upstream contribution.
Defining sharding
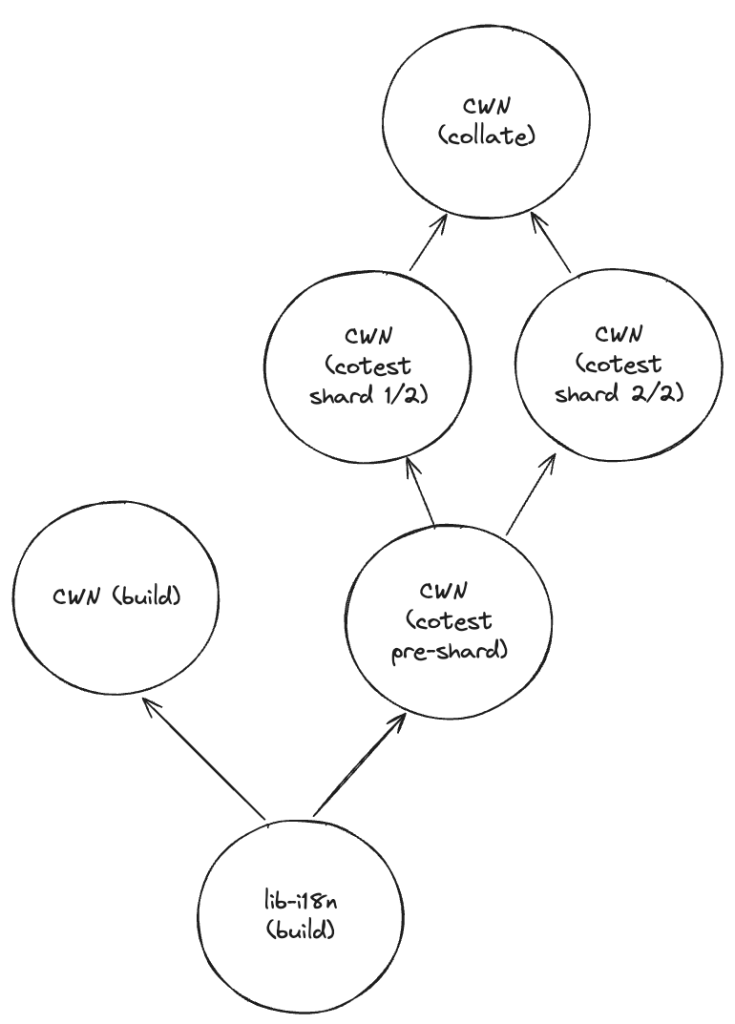
There are two phases in sharding: the actual work and the collation of output from the shards. In our case, we need to run the Jest tests as the actual sharded work and then collate the coverage data into a single report for our coverage provider. To simplify the dependency graph, we also introduce a new pre-shard step — a structural node that retains a sharded node’s dependency information. This reduces the number of new edges to the number of shards times two, rather than the number of shards times the number of dependencies plus the number of shards.
Implementing shards for Rush
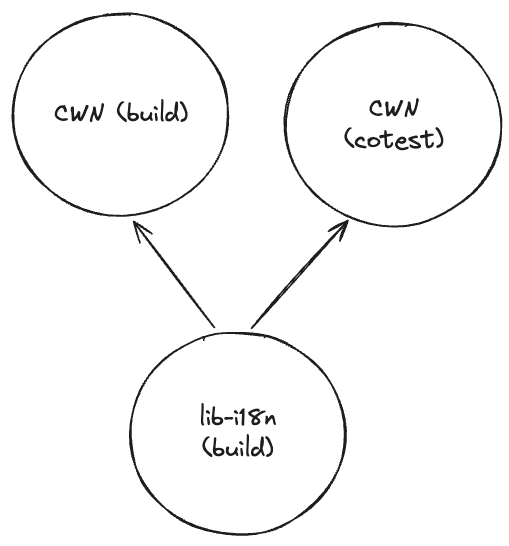
We splice in three new node types when an operation is indicated for sharding, as shown in Figures 1 and 2 below:
- We first add the pre-shard operation, which retains the dependencies from the original operation.
- We then add n new operations, where n is the number of shards.
- Finally, we add a collate operation, which retains the consumers of the original operation.
Before sharding, our operation graph looked like this:
After sharding, the operation graph looks like this:
We also need to pass down the shard index for each shard in the new operation graph. Shards will use that index to produce stable, disjointed sections of work.
With sharding implemented, test execution times dropped to approximately five minutes per shard. But it became critical to ensure effective caching to avoid running tests unnecessarily.
Building a cache for shards
Each shard requires a unique folder to store its output assets; that dynamic folder is passed down through the task performing the sharded work. This is important because the build cache requires that input folders be disjointed. Bypassing that restriction for local builds could result in running two shards that write to the same folder, causing restore issues.
In this case, fortunately, it’s as simple as creating a new --shard-output-directory flag. Our design goal was to allow templating, allowing users to run shardable commands directly from their package.json without an additional transformation layer.
Results
Manual testing found that four shards, each with seven workers, offered the best performance. All of the test shards completed within six minutes, which tied build time and test time.
Dynamic agent usage
While we celebrated the drop in CI time to six minutes for our biggest project, we noticed an alarming trend. Our cobuilds were starting to execute long-running tasks in sequence, indicating that we weren’t scaling to the correct number of agents. Previously, we had managed to reduce agent count from ten to five. We have, however, been steadily growing our monorepo and starting to improve that number.
Layer-based scaling
One way to determine the number of tasks that need to run in parallel is to find the layer with the most tasks, adjusted by weight. Optimizing the number of agents for that layer should provide a good approximation of maximum agent efficiency. What does that actually look like, though?
Figure 3 below shows a simple graph with three operations — CWN, lib-i18n and lib-platform build steps. The dependency tree is straightforward and it’s clear that there are three layers.
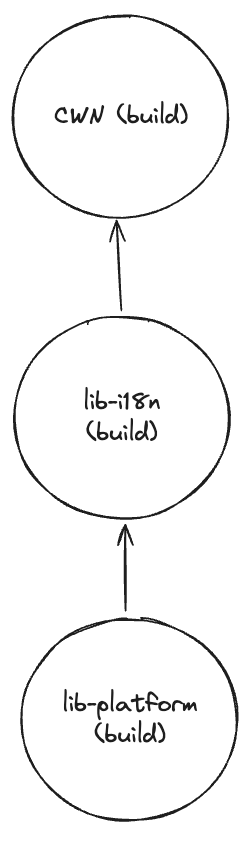
Figure 4 shows a more complex graph with dangling test nodes that don’t have any consumers. They populate on the layer above their package’s build node; because CWN’s co-test can run in parallel with build, we can consolidate layers. Nonetheless, this graph still has the same number of layers as shown in Figure 3.
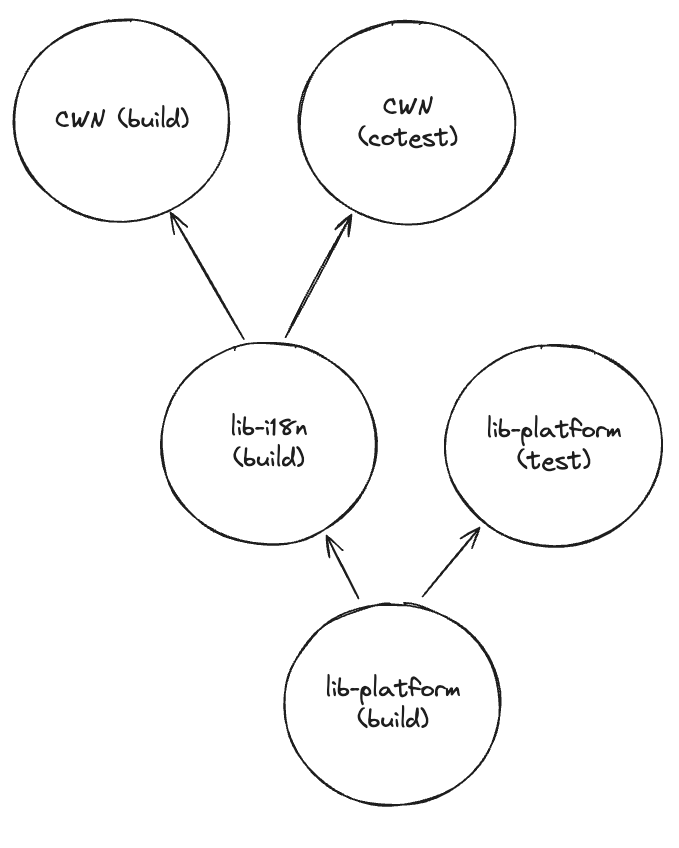
Figure 5 shows additional complexity – competing dependency layers – with lib-platform now either one or two hops from CWN. This level of complexity momentarily gave us pause, particularly in regards to the separate dependency trees.
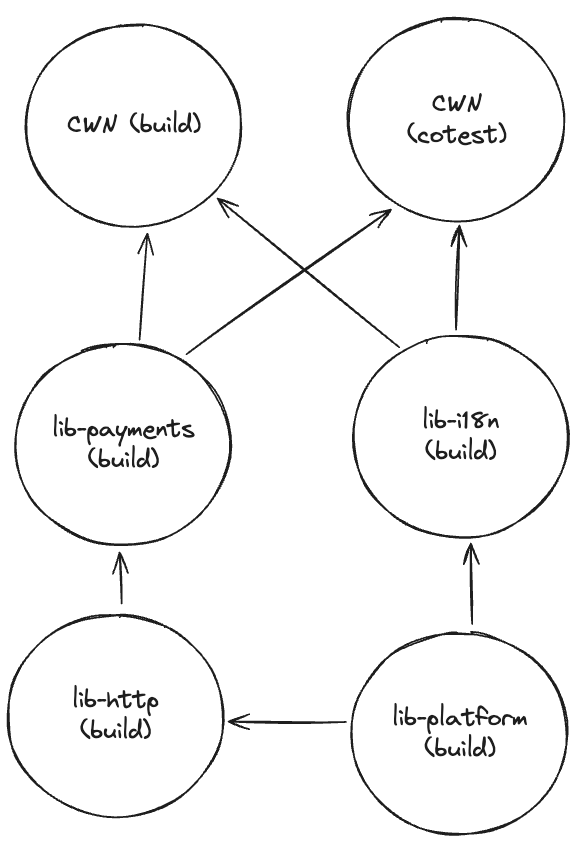
By updating our visualization of the problem, however, we achieved a breakthrough. By moving the root node to the bottom of the graph and framing this as a graph of dependency completion time, as shown in Figure 6, we can visualize the layers of the build graph much more easily. Note that lib-i18n can start building immediately after lib-platform finishes, but lib-payments must wait for lib-http. That waiting determines the layer structure. The same logic also can be used to handle completely disjointed dependency trees.
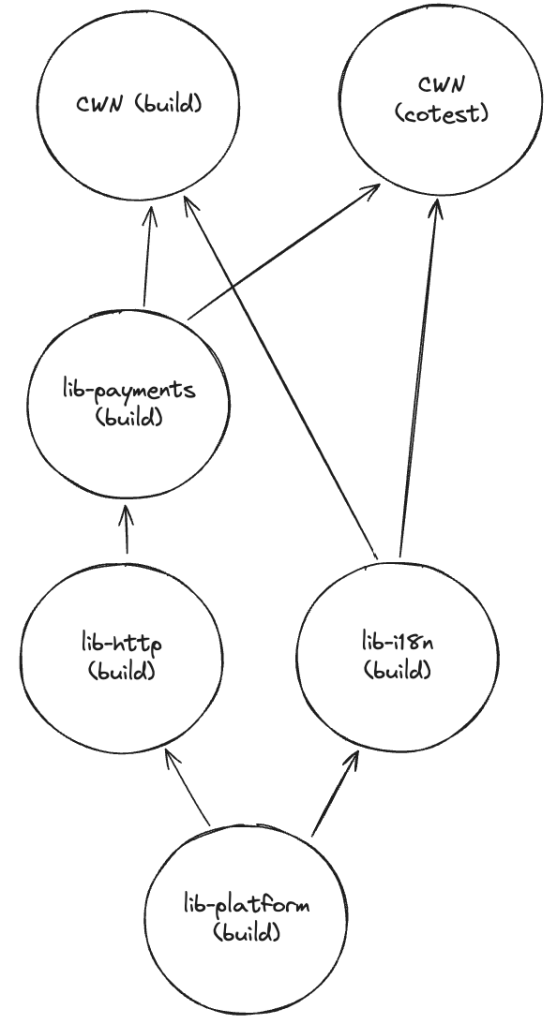
This results in the following algorithm:
export function extractGraphLayers(operations: Operation[]) {
 let currentLayer: Operation[] = []
 const queue: Operation[] = []
 const nextLayer: Set<Operation> = new Set<Operation>()
 const visited = new Set<Operation>()
 for (const operation of operations) {
   if (operation.dependencies.size === 0) {
     currentLayer.push(operation)
     queue.push(operation)
     visited.add(operation)
   }
 }


 const layers: Operation[][] = [currentLayer]


 /**
  * In order to determine the maximum width of the build graph, we need to traverse the graph in a breadth-first
  *   _layer_ manner. We start at the base of the graph with our first layer of operations with no dependencies. We
  *   then move up the graph layer-by-layer, adding operations to the next layer and collapsing no-op operations into
  *   their consumers. This allows us to determine the maximum width of the graph, which is the maximum number of
  *   operations that can be executed in parallel.
  */
 while (queue.length > 0) {
   const current = queue.shift()!
   visited.add(current)


   for (const consumer of current.consumers) {
     let consumerQueue = [consumer]


     // Collapse no-op operations into their consumers. This ensures that only operations with work show up
     //  at the same level. For example, if we have 1 set of operations that depends on packageA and another
     //  that depends on packageB, neither of those packages have a build step, so we'd want to treat their consumers
     //  as the same level because they would be executed at the same time.
     while (consumerQueue.length > 0) {
       const operation = consumerQueue.shift()!
       const dependenciesAreComplete = [...operation.dependencies].every((e) => visited.has(e))
       if (visited.has(operation) || !dependenciesAreComplete) {
         continue
       }
       if (operation.isNoOp) {
         visited.add(operation)
         consumerQueue.push(...operation.consumers)
       } else {
         nextLayer.add(operation)
       }
     }
   }


   if (queue.length === 0 && nextLayer.size !== 0) {
     // Move to the next layer.
     layers.push([...nextLayer])
     currentLayer = [...nextLayer]
     queue.push(...nextLayer)
     nextLayer.clear()
   }
 }


 return layers
}
End results
With the above improvements, we managed to reduce build/test time for CWN from 22 minutes to six minutes, a reduction of 73%. We also managed to better utilize our build fleet, moving from a fixed 10 agents per commit to dynamic allocation. For CWN, this results in a drop from 220 minutes per run to 30 minutes per run — a whopping 86% reduction. We maintain a warm fleet of machines, so this drop doesn’t affect our CI costs. Instead, it allows us to scale more effectively with our existing agent pool.
Today, the number of lines of code in CWN has grown by an additional 15%. Without the improvements described here, each build would take 33.5 minutes. Instead, builds now complete in just nine minutes, providing monthly savings of 4.5 engineering months during which developers don’t have to wait for CI to complete.
We achieved all of this through more than 20 open-source changes to the Rushstack project to support sharding and weight-based locking. We want to extend a huge thank you to the Rushstack maintainers for their reviews and support for adding these new features!
Key takeaways and next steps
Impact of open-source contributions: At the outset of this journey, we were concerned about the uncertainty involved in contributing patches to open-source projects. Each project has a different standard for code, which can balloon the effort to get a patch accepted; there are no guarantees that maintainers will ever accept a proffered feature. Previously, our team had a patch merged. We had also been through a previous attempt to add a feature that had gone stale. Our successful implementation enhanced our confidence that additional contributions likely would be worthwhile investments.
If we had decided not to follow this open-source path, we would either have had to do a fork or maintain a patch to the upstream code. Both options would have frozen us in time, requiring either significant engineering effort to ensure a patch worked across versions or, alternatively, pulling in the latest fork alterations and then layering our changes on top. Fortunately, work on Rush remains active, with new features being released every few weeks, making it well worth staying up to date.
Reconsidering the meaning of operation weights: Weight can be used as an indicator for many different things. It can imply high memory or CPU usage, or anything in between. Using weight instead of memory or CPU usage is like trying to perform surgery with a spoon; it may work, but it’s certainly not the best tool for the job. Ultimately, we’re trying to optimize time spent in CI — the time it takes to complete all operations from the root to the longest leaf node. While weight is important for ensuring that operations are not overloading single agents, it’s a separate variable. This remains an unsolved problem for us, but something we’re interested in addressing as our monorepo continues to grow.
Pushing our tooling even further: A key lesson from our experience is that tooling can be pushed further than expected, either through its interface or through contributions to the open-source project. We ultimately benefited tremendously from diving into why we were saving a Webpack cache to disk on our CI runners that wasn’t restored anywhere, or running linting synchronously instead of in parallel to build. Maintaining this ethos has guided recent explorations like incremental caching in CI.