
DoorDash has significantly evolved its traffic platform in recent years, transitioning to a service mesh architecture that now supports more than 80 million requests per second during peak hours. This post is the first in a series that will cover the early phase of that journey. We’ll share the initial motivations behind the shift, the architecture we established in the early days, how we migrated more than 1,000 microservices to the new platform, issues we encountered along the way, and some of the key lessons learned.
Motivating the move
Ultimately, DoorDash’s move to a service mesh was prompted by the difficulties during a different transition — from a monolith to a microservices architecture between 2019 and 2023. We encountered many of the classic challenges:
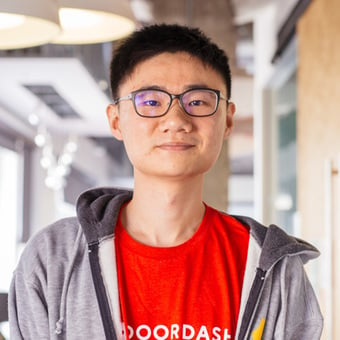
- Lack of a standard pattern for service-to-service communication, as shown in Figure 1 below. Depending on the team or the era when the service was created, it might communicate in one or more of the following ways:
- HTTP/1 services relied on Kubernetes DNS and static virtual IPs, with iptables handling connection-level load balancing.
- Newer services used a Consul-based multi-cluster DNS, which returned all pod IPs — similar to Kubernetes headless services — and relied on client-side load balancing, which may or may not be correctly implemented.
- Some gRPC services were exposed through dedicated AWS ELBs, which forwarded traffic to any node in the cluster, and then to the correct pod via iptables by setting external traffic policy.
- Requests to some services were routed through a central internal router.
- Others made a full round-trip through a public DoorDash domain before hairpinning back into the internal system — an approach that hurts both performance and reliability.
- Inconsistent implementations of critical platform-level features, such as:
- Authentication and authorization
- Retry and timeout
- Load shedding and circuit breakers
- Increasingly complex service topologies, making system-wide visibility and debugging far more difficult than it should be. As shown in Figure 2 below, it was hard to quickly identify the root service responsible for a site-wide outage due to the complex service graph.

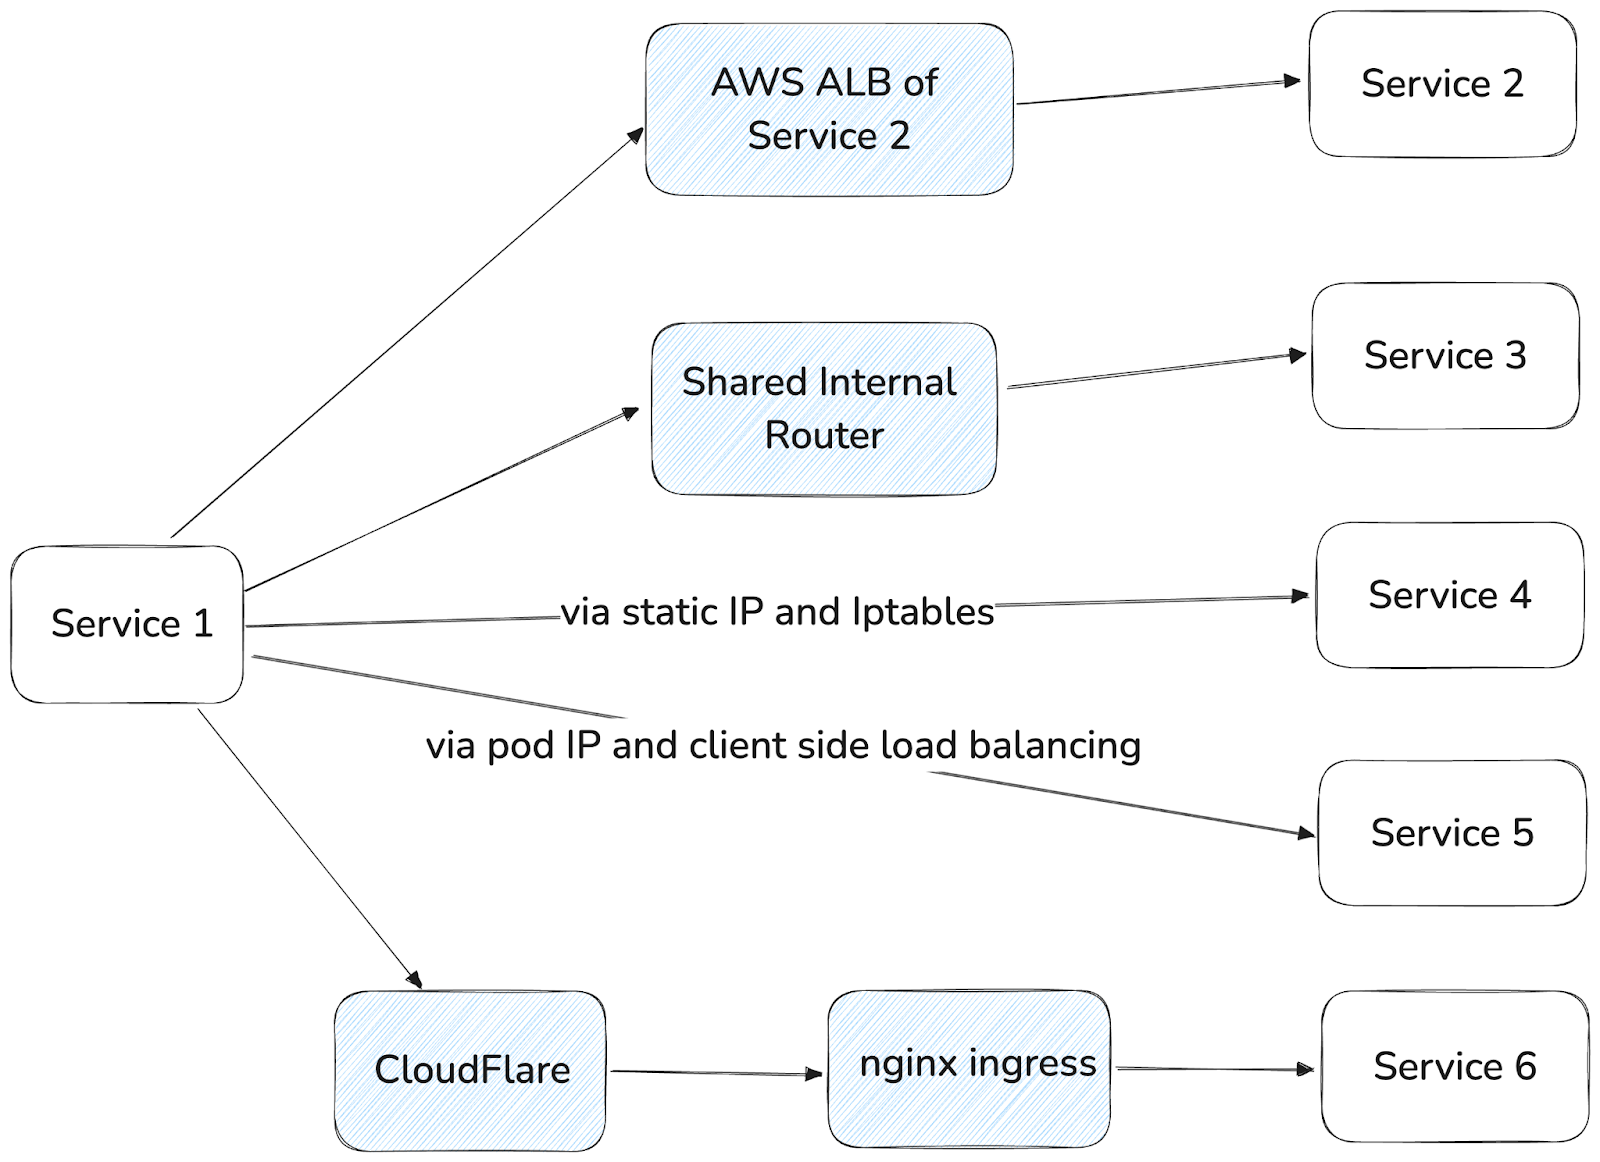
In mid-2021, DoorDash experienced a major production outage that lasted more than two hours. As shown in Figure 3 below, the root cause was high latency in the payment service, which led to aggressive client retries that overwhelmed the service and triggered a cascading failure.
We had implemented several reliability features in our services using Kotlin, our primary language for microservices. But not all services used Kotlin — including the payment service — which meant they either had to roll their own mechanisms or go without. Because we had already experienced a series of similar incidents, we had implemented a code freeze across multiple teams so that they could focus entirely on reliability. But the outage made one thing abundantly clear: Platform-level safety features like Layer 7 metrics-aware circuit breakers and load shedding were no longer optional; they had to be built into the infrastructure. This drew broader attention to an ongoing experimental service mesh project that the Core Infrastructure team had just started to prototype.
Setting goals
Our immediate goal was to deliver a minimal feature set to the two major services involved in the outage within three months while supporting broader onboarding within another three months. The initial mesh rollout focused on load shedding, circuit breakers, and traffic-level metrics, all while keeping extensibility in mind for future enhancements. Among the primary goals were:
- Scalability: At the time, most of our stateless microservices were running in a single Kubernetes cluster with around 2,000 nodes. We typically grew cautious when a cluster exceeded 1,000 nodes, as that scale approached the upper bounds of what many of the open-source tools we depended on had been validated against. At this scale in practice, we encountered unpredictable scalability issues. We needed our service mesh solution to support our growing infrastructure reliably without introducing additional bottlenecks.
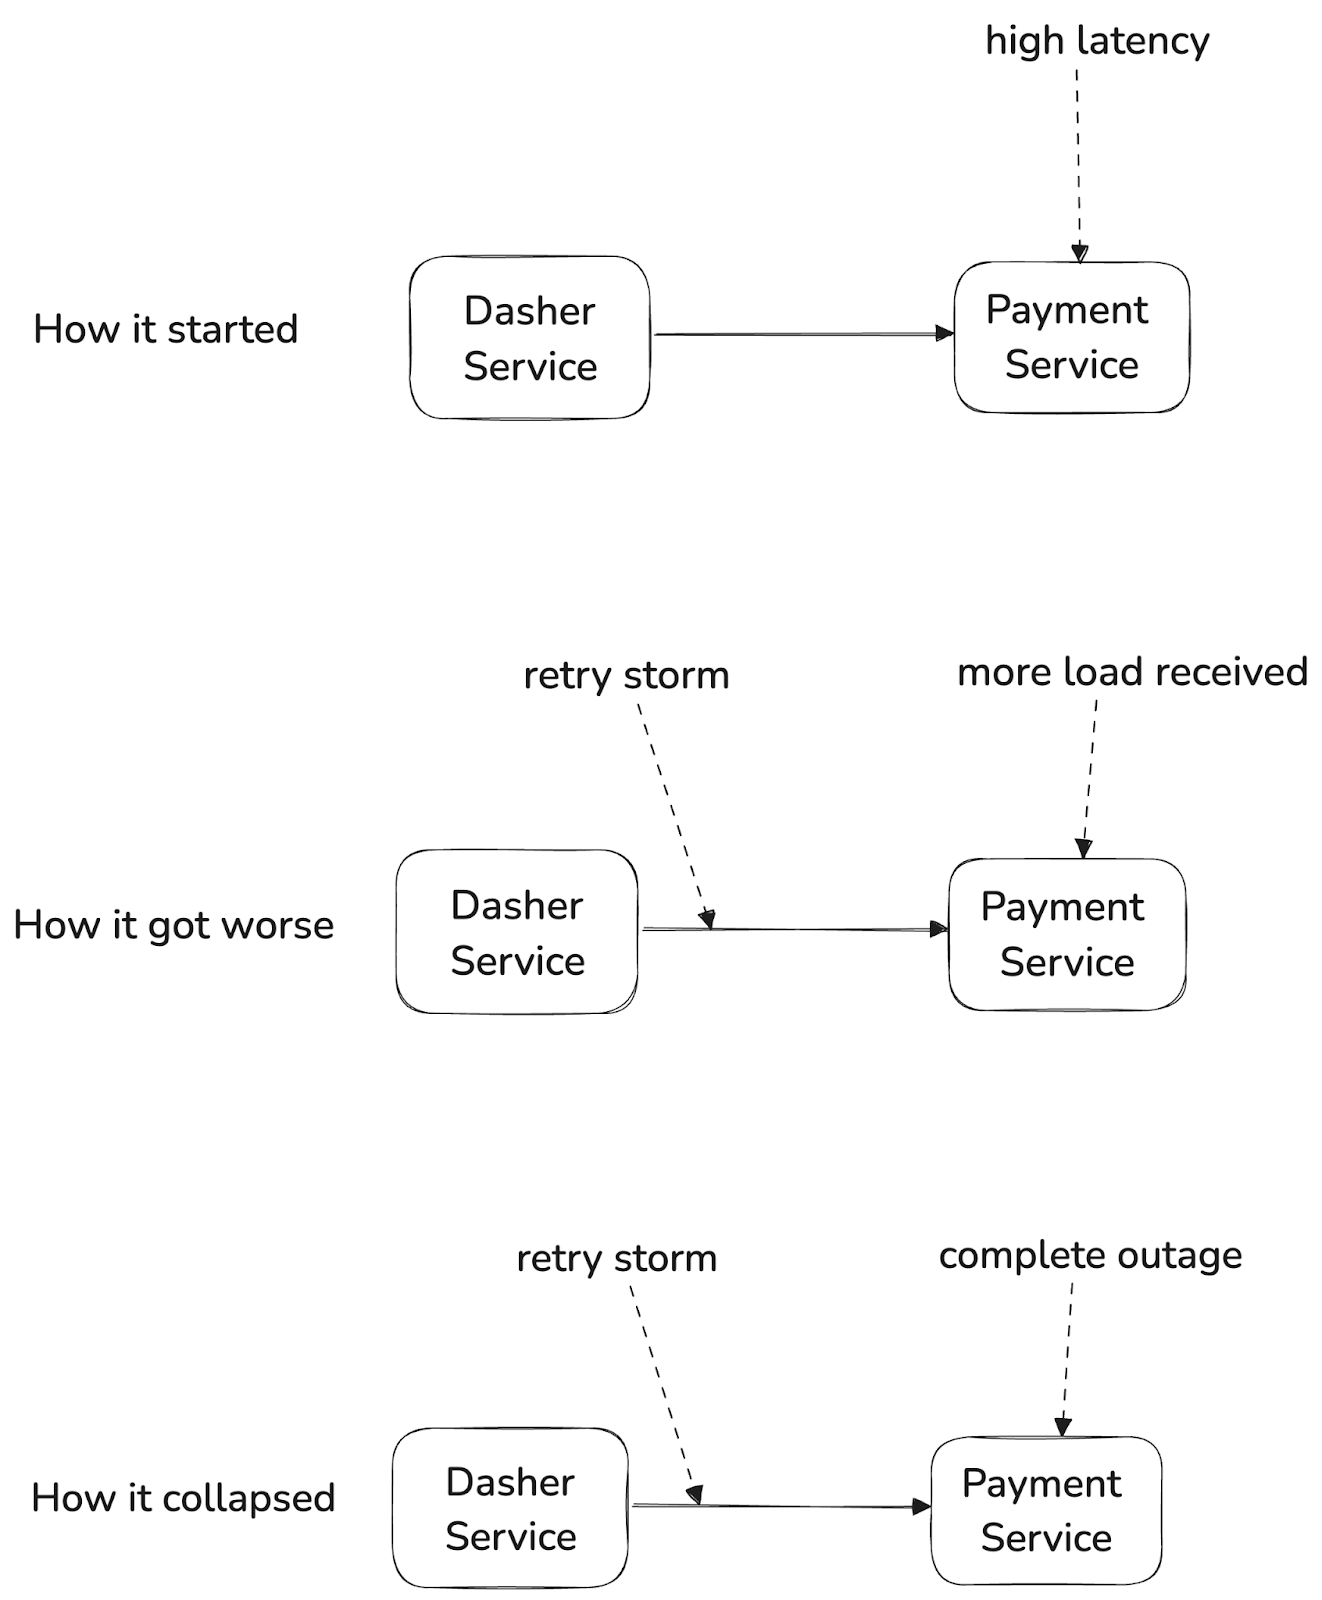
- Standardization: As highlighted earlier, service-to-service communication at DoorDash was anything but standardized. There were too many patterns in use, creating operational and debugging headaches. We committed to a unified model built around a Consul-based multi-cluster solution. As shown in Figure 4 below, the high-level architecture looked like this:
- Each pod was assigned an elastic IP via AWS CNI to maintain a flat network.
- A singleton process in each cluster sent the latest pod IPs to a centralized Consul cluster.
- Clients issued DNS queries through the local CoreDNS DaemonSet.
- On cache miss, CoreDNS forwarded to the local Consul agent, which in turn forwarded to the Consul server as needed.
Our service mesh had to integrate seamlessly with this setup and accelerate adoption of this standardized communication model.
- Production readiness: Introducing a platform layer to improve reliability shouldn’t come at the cost of introducing new reliability risks. The mesh solution had to be proven in production and ideally backed by success stories from companies operating at a similar scale. It needed to be stable, well-documented, and easy to configure.
- Compacted timeline: Initially, two engineers from the Core Infrastructure team were exploring service mesh in their spare time. The outage quickly reset their priorities. Rather than aiming for a complete solution, they focused on shipping the most critical reliability features as fast as possible.
Initial architecture
After evaluating various open-source service mesh solutions — including Istio, Linkerd2, and several others — and speaking with engineers at other companies, we ultimately chose Envoy as our data plane. We also decided to build a custom control plane tailored to our needs.
At the time, Istio’s complexity and ongoing re-architecture raised concerns about operational burden, particularly around scalability, debugging, upgrades, and configuration management. With only two engineers working on this project and limited resources until we could demonstrate its value to leadership, we knew that maintaining Istio would likely require a much larger team.
Linkerd2 offered a much simpler operational model, but reduced feature support. Unfortunately, it lacked critical reliability features we needed to mitigate the kinds of outages we had experienced. It also would have required upstream contributions to integrate with our Consul-based multi-cluster setup. We also had additional reservations about long-term support given Linkerd’s smaller community compared to Envoy and Istio at the time.
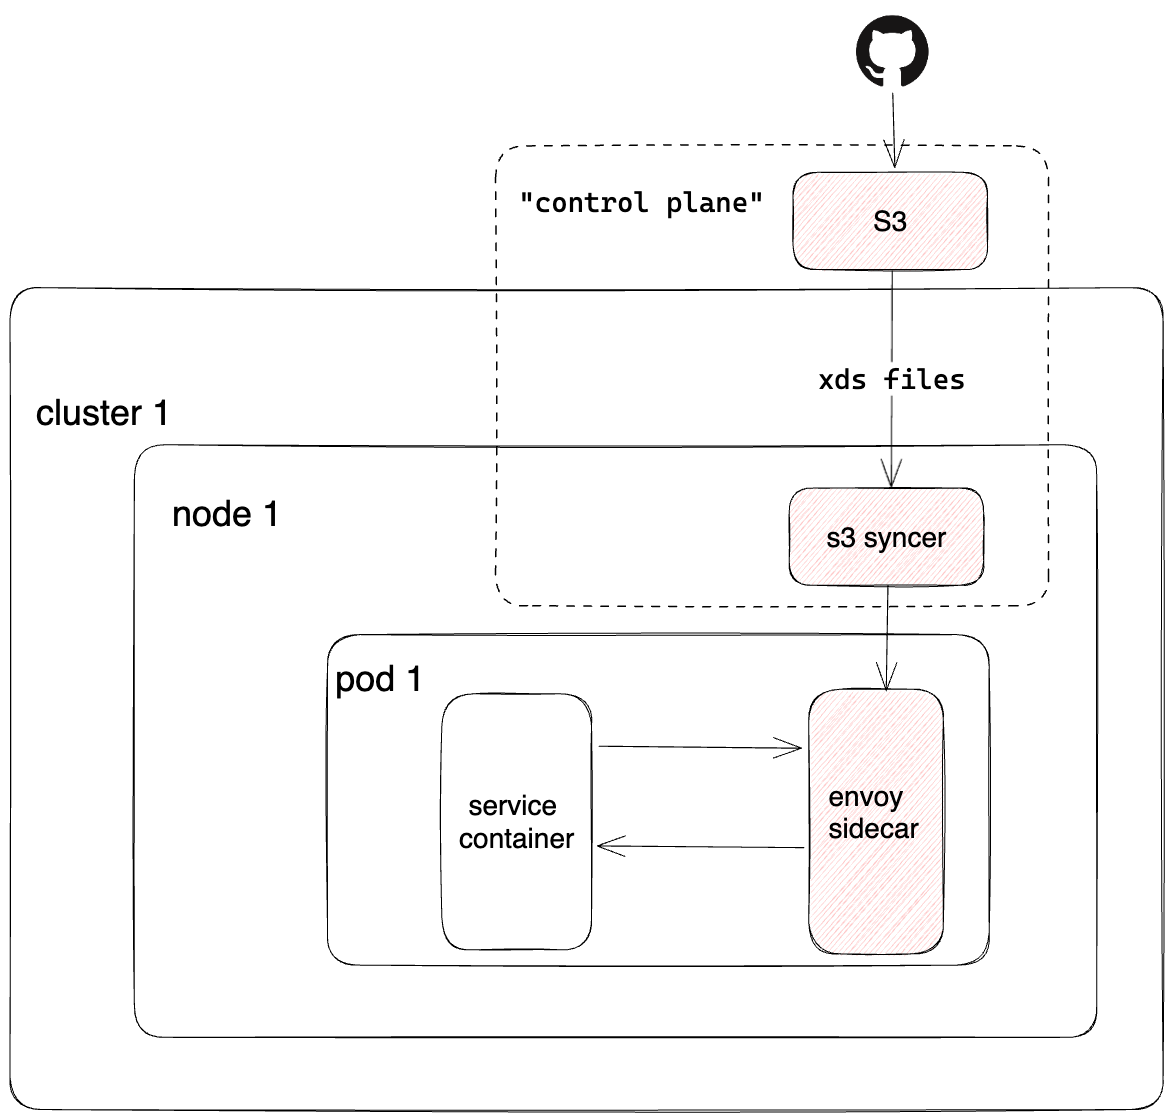
As shown in Figure 5 below, to get started, we took a pragmatic, MVP approach, including:
- A Kubernetes mutating webhook injected the Envoy sidecar and init containers into each pod with the "service-mesh-enabled: true" label set.
- Iptables rules redirected all HTTP1/HTTP2/gRPC traffic through the Envoy sidecar, while traffic on reserved ports — typically used for non-HTTP protocols — bypassed the mesh.
- Instead of using dynamic configuration via xDS APIs, we opted for a file-based configuration model. Users wrote raw Envoy configs in a GitHub repo, which were packaged and pushed to AWS S3 buckets through our CD pipeline.
- A DaemonSet on each node pulled the config from S3, extracted it, and mounted it into sidecar containers. Envoy would hot-restart whenever its config files were updated.
We focused narrowly on three key features built into Envoy:
- Adaptive concurrency
- Outlier detection
- A Grafana dashboard reported by the Envoy sidecar to visualize traffic-level metrics
To enable these features, users were required to manually declare their egress dependencies, which allowed the control system to add a dedicated CDS cluster for each upstream service. We used STRICT_DNS as the service discovery type to resolve these destinations.
Because we didn’t yet have full visibility into service-to-service dependencies, the sidecar was configured as an HTTP passthrough proxy. This ensured that traffic could still reach the original destination even if an egress dependency was not explicitly declared, enabling seamless onboarding with minimal disruption.
We weren’t calling the project a service mesh at this stage. Internally, it was simply known as the Envoy sidecar project. The configuration model was primitive and lacked a control plane. But the goals were clear: Establish a working data plane, gain operational experience running Envoy at scale, deliver immediate reliability improvements, demonstrate impact to the leadership team, secure more resources, and ultimately evolve the architecture into a unified, feature-rich platform we could rely on.
Stay Informed with Weekly Updates
Subscribe to our Engineering blog to get regular updates on all the coolest projects our team is working on
Please enter a valid email address.
Thank you for Subscribing!
Onboarding two services
After we successfully implemented and tested the solution in staging, we onboarded two critical Python services: the payment service and the notification service, which were among the services involved in the previous site-wide outage.
The onboarding process involved two main steps:
- Labeling the Kubernetes deployment and namespace to trigger Envoy sidecar injection, and
- Creating raw Envoy configurations customized for each service.
We used a canary deployment approach as shown in Figure 6 to introduce the Envoy sidecar gradually and safely, which involved rolling it out to a small subset of a service before expanding to the full deployment. Each user created a separate canary deployment using the same container image as their production workload, but with the service mesh label attached to enable sidecar injection. This canary deployment reused other labels for the production deployment, ensuring it matched the selectors in the existing Kubernetes service object.
As a result, the canary pod IPs became routable via existing service discovery mechanisms — including through virtual service IPs, headless services, nginx-ingress, and Consul DNS. Traffic was automatically distributed to both production and canary pods, allowing developers to control traffic exposure by adjusting the canary’s replica count. Once we gained confidence in the sidecar’s performance and reliability, we scaled down the canary deployment and updated the main production deployment to use the sidecar.

We rolled this out gradually over two weeks to allow any unknown issues to surface. It was a smooth and successful launch. In fact, the service mesh project maintained a record of zero delivery loss throughout all service migrations.
General availability
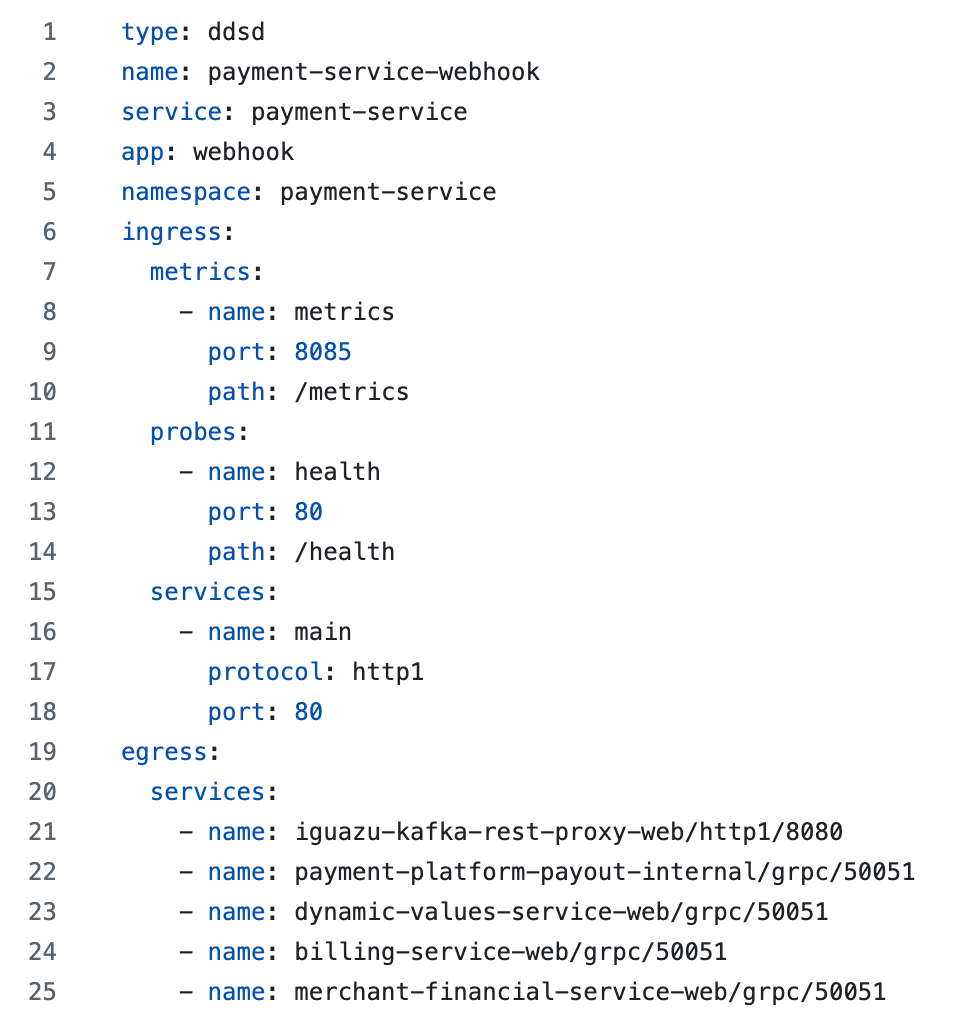
After successfully onboarding the two critical services, we began preparing for general availability. To support adoption at scale, we introduced configuration templates — an example can be seen in Figure 7 — eliminating the need for developers to manually write raw Envoy configurations, which would have been nearly impossible to do safely and consistently.
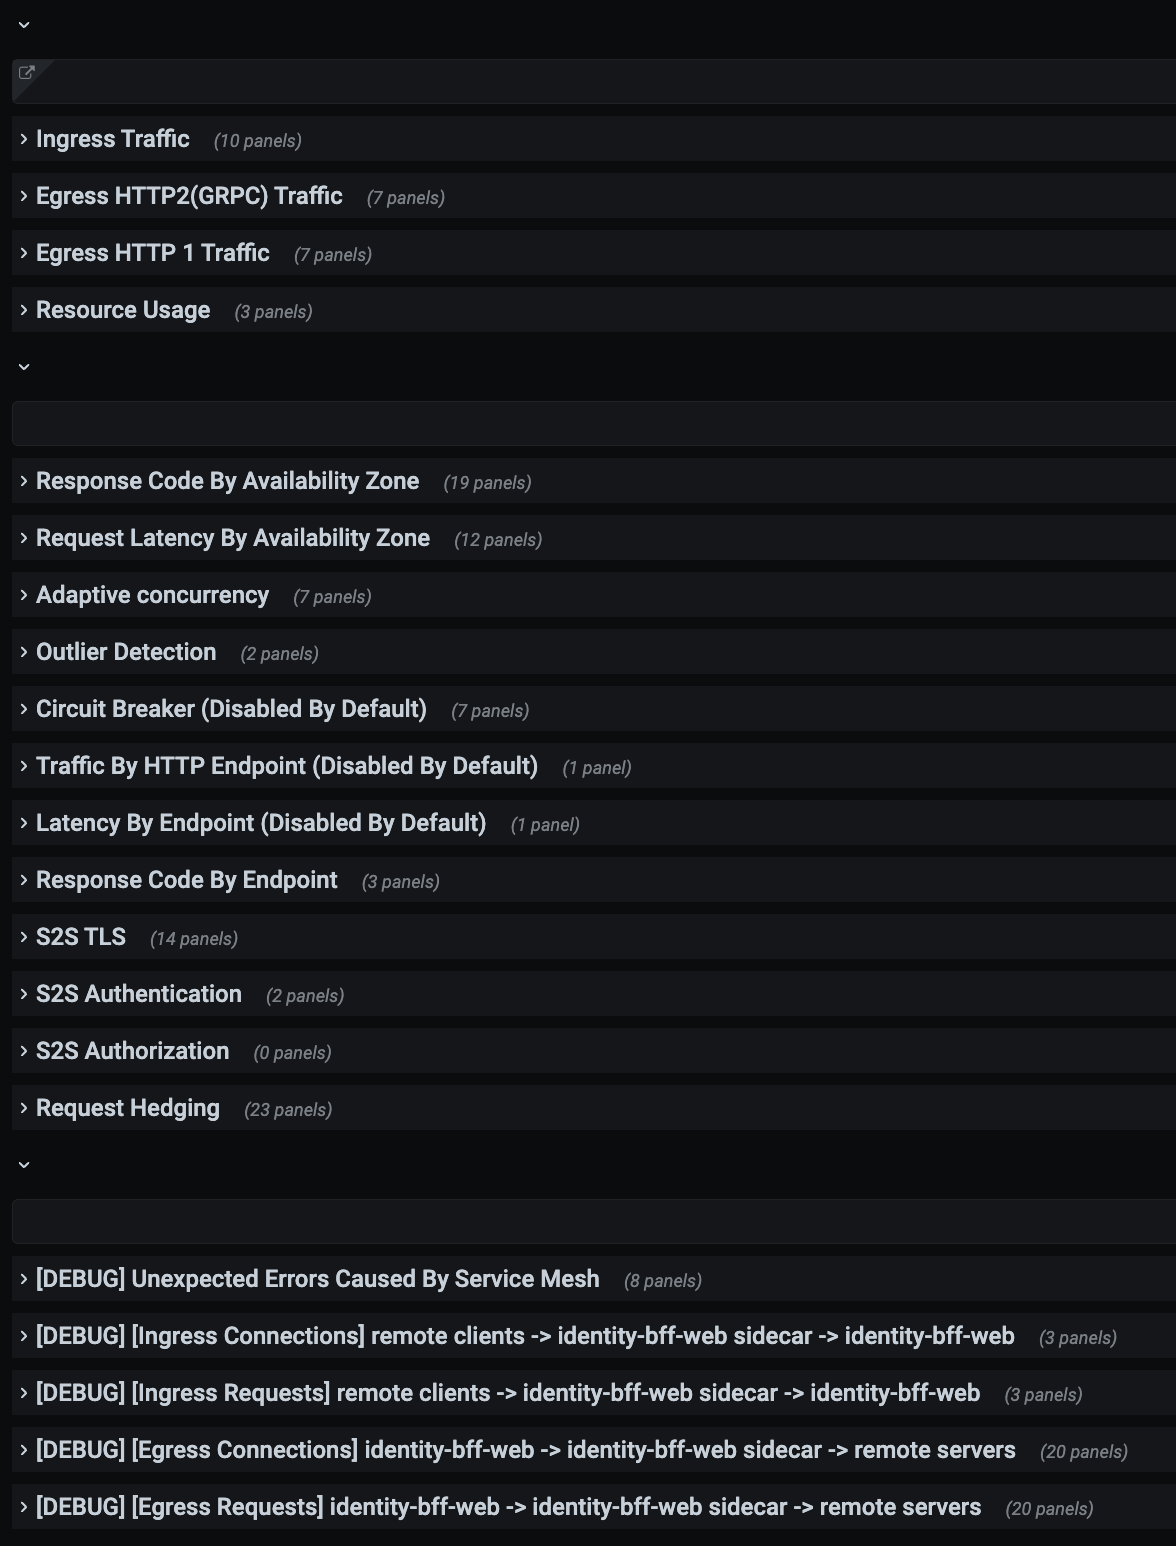
We also provided a centralized dashboard, shown in Figure 8, for networking metrics reported by the Envoy sidecar, along with shared alert modules and runbooks to help teams respond quickly to common issues like high error rates or increased latency.
With these improvements in place, we proactively expanded adoption by reaching out to early adopters and bringing services on board that were written in a broader range of programming languages. At this point, we officially declared the Envoy sidecar project generally available.
Extending features
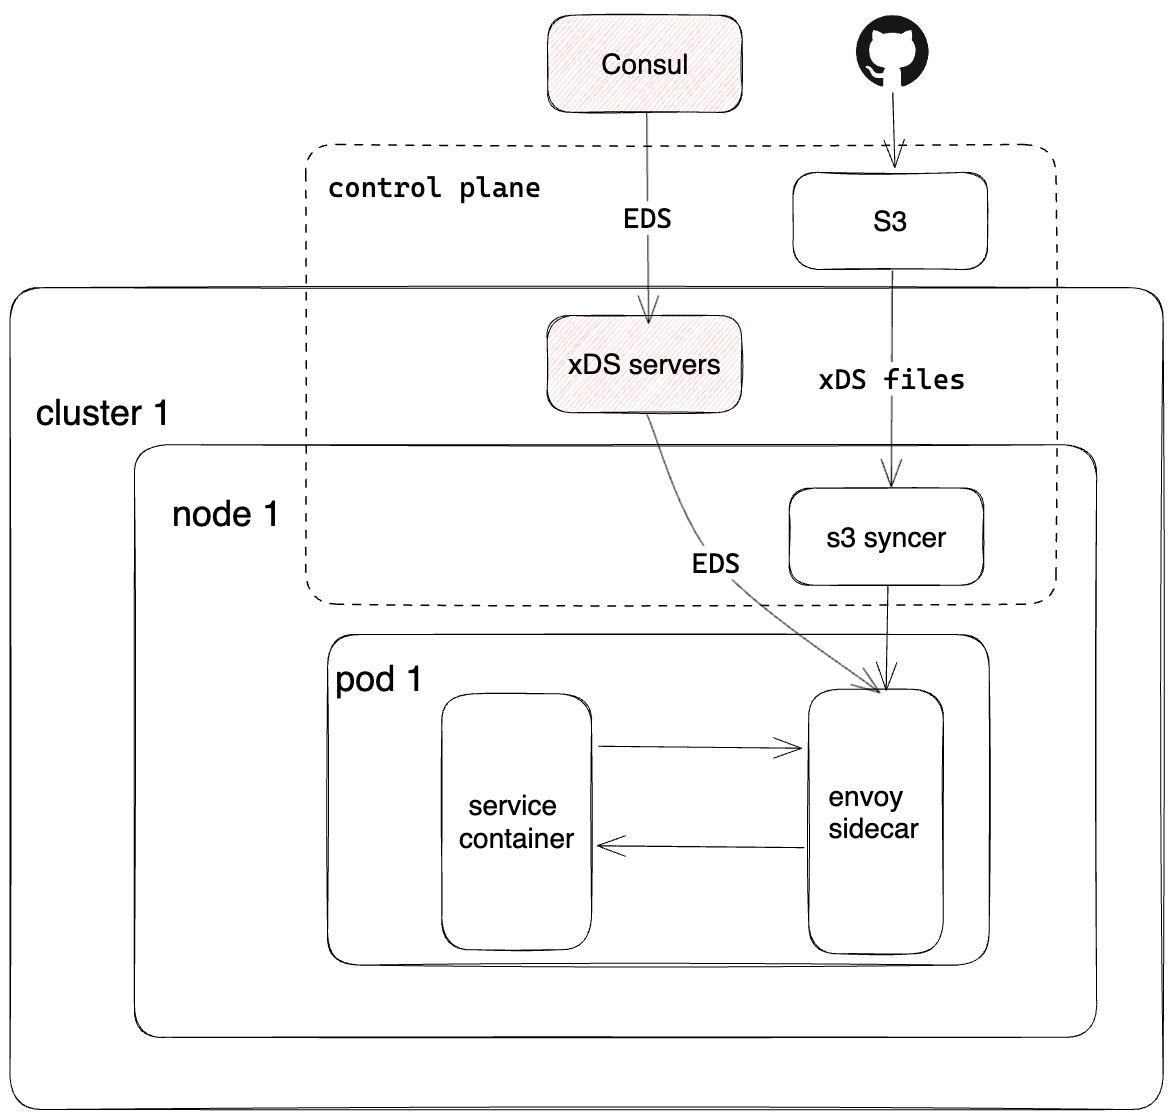
As we onboarded more services, we began receiving traffic management feature requests from internal platform teams. One notable addition was zone-aware routing. Because Envoy’s zone-aware routing requires endpoint discovery service, or EDS, as the service discovery type, our earlier STRICT_DNS-based file configuration no longer met our needs. As shown in Figure 9, we used this as an opportunity to evolve our configuration management system and introduced API-based dynamic configuration for EDS resources. We developed an xDS control plane to read IPs and availability zone metadata from Consul to deliver them to the Envoy sidecar via EDS.
As adoption grew, we began using header-based routing to support more advanced use cases, enabled via Envoy’s route configuration. Two examples illustrate how this evolved:
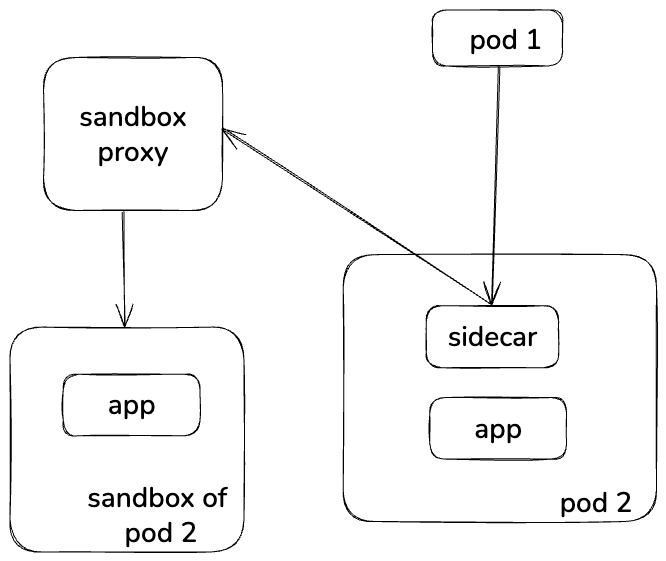
- To improve developer velocity, we partnered with the Test Platform team to enable safe testing in production. As shown in Figure 10, this model allowed ingress traffic to be conditionally redirected to a service’s sandbox version using the Envoy sidecar.
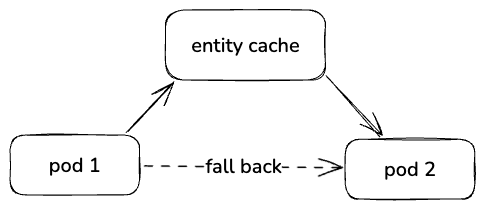
- The Storage team developed an entity cache service, shown in Figure 11, to reduce request latency by caching API responses on behalf of clients. This required the Envoy sidecar to dynamically route egress traffic based on the gRPC method name and fall back traffic to the origin service when the entity cache service was degraded.
Over time, we continued adding features to the mesh. With the foundation already in place, onboarding new services required far less advocacy. Momentum grew as the mesh evolved into a powerful platform lever.
Issues we encountered
As we onboarded more services to mesh, we ran into a wide range of unexpected issues, many of which didn’t surface until after the Envoy sidecar was introduced. While we hoped the mesh would be transparent, in reality, the data plane wasn’t invisible. Many hidden behaviors emerged during onboarding, especially from Tier 0 services. In retrospect, these were expected and simply surfaced issues that had previously gone unnoticed. Ultimately, they helped us pave the way toward a more standardized, resilient traffic communication layer. Among these issues were:
- HTTP/1.1 race condition
We observed occasional 503 errors — especially after peak hours — for HTTP/1.1 services. This was because of a known race condition in HTTP/1 protocol: When an HTTP/1.1 server closed a keep-alive connection, a client might send a new request right after the server sent the FIN packet, but before acknowledging it. Envoy would then report the error with upstream_reset_before_response_started{connection_termination}.

Figure 12: An example of HTTP/1 race condition
As shown in Figure 12, after one successful health check, the server sent the FIN packet back to the client to close the connection (packet 2565). Meanwhile, the client sent a new request to the server (packet 2566). At this point, the client had not received or processed the FIN packet yet. When the server received the new request, it sent RST back to the client because the connection was already closed on its side. We believe this behavior occurred even before the Envoy sidecar was introduced. However, the issue was exacerbated because fewer connections are established between the Envoy sidecar and each server process.
Our fix was to ensure that HTTP/1 clients closed connections proactively, usually by setting the client’s max connection age to 240 seconds and the server’s to 300 seconds.
- HTTP/2 first communication
Some client libraries we used, such as armeria, defaulted to HTTP/2 first, falling back to HTTP/1 when the destination didn’t support it. After onboarding, the client Envoy sidecar accepted the HTTP/2 downstream connection and forwarded the traffic using the HTTP/2 passthrough proxy. However, the upstream server didn’t understand HTTP/2, which caused connection errors. This behavior was previously invisible, but sidecar injection surfaced it immediately.
To address this and ensure a smooth migration, we disabled the default behavior in our internal libraries and asked users to upgrade to the latest version to apply the fix.
- Imbalanced gRPC traffic
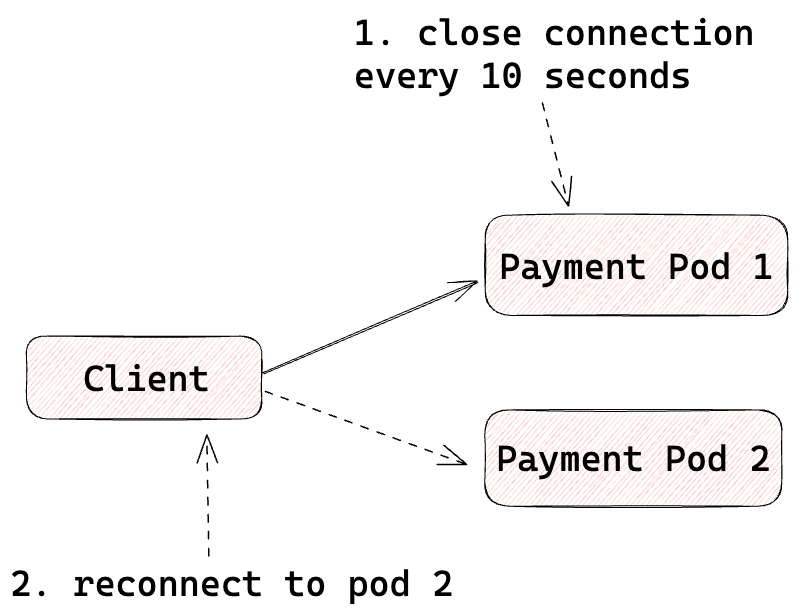
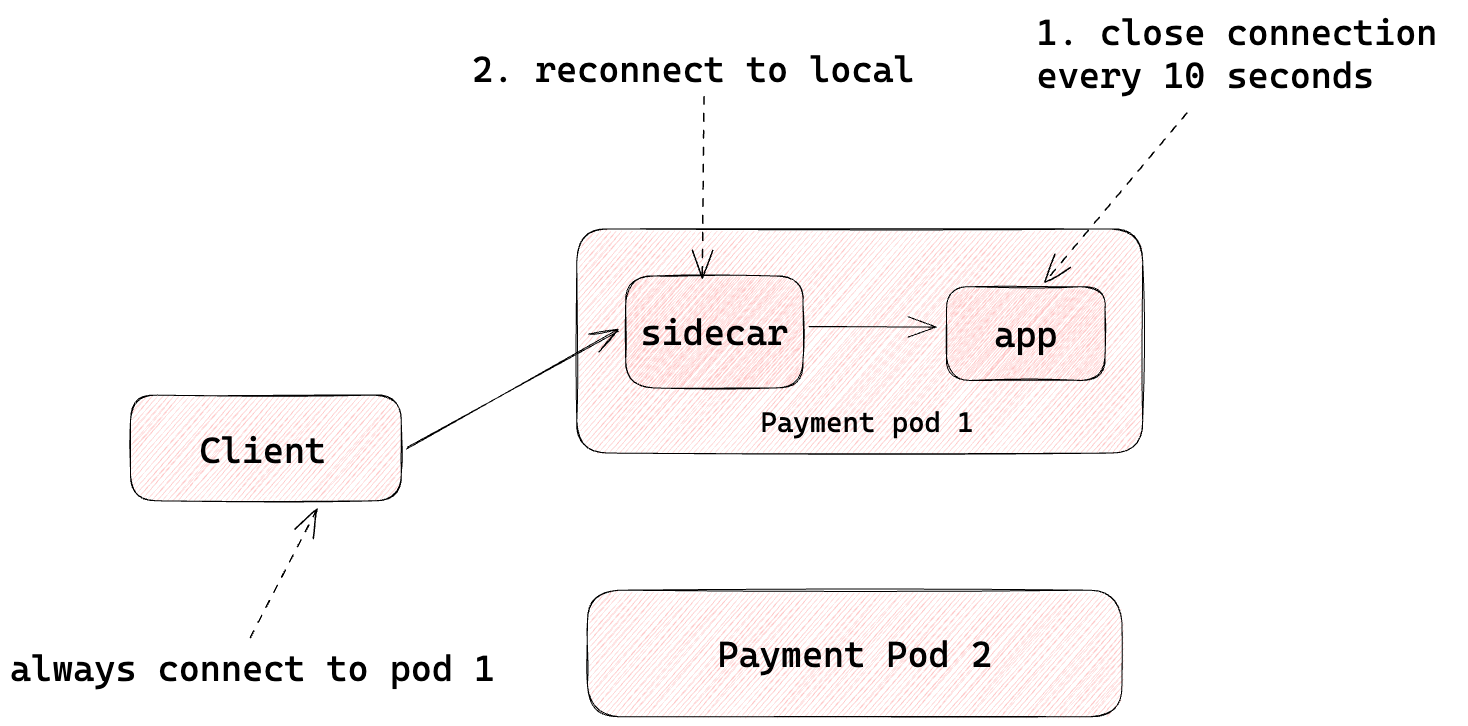
We realized that one monolithic application didn’t implement client-side, request-level load balancing for gRPC traffic. Instead, as shown in Figure 13 and Figure 14, it relied on servers periodically closing connections to rebalance clients. Injecting the Envoy sidecar into server pods disrupted this behavior, eventually leading to imbalanced traffic across pods.
To address this, we moved connection aging behavior into the Envoy sidecar, tuning its connection age settings to mimic the old pattern.
- HTTP/2 multiplexing
We found that some servers couldn't handle the number of concurrent HTTP/2 streams that they claimed they could handle. To address this, we had to configure each server’s Envoy sidecar to enforce the correct limit using max_concurrent_streams to expand the parallelism by increasing the number of connections.
- HTTP/2 connection blast radius
We found a compatibility issue between the client’s library and the server’s outdated custom library. This caused destruction of HTTP/2 connections between the sidecar and server process, which had a cascading effect on other, more important, services that called the server. This shows that even dedicated Envoy proxies weren’t completely immune to unexpected blast radius effects.
- Non-HTTP traffic
Because we primarily used Envoy as an HTTP proxy, services communicating over other protocols required manual configuration to prevent the sidecar from intercepting specific ports. This became a recurring task as we uncovered additional services speaking more than one protocol.

- DNS staleness and unavailable errors
When server pods restarted, some clients began reporting 503 errors indefinitely until they restarted themselves. The root cause was that Envoy’s original destination cluster preserved downstream connections and continued routing with stale IPs returning 503s, as some client libraries failed to refresh the DNS during retries. Before the service mesh, these clients would have received layer 4 connection errors and retried their DNS resolution (here you can see a similar GitHub issue).
To mitigate this, we built an automated pipeline to detect missing egress dependencies through tracing data and auto-generating pull requests to register those dependencies for each service.
- Envoy circuit breaker defaults
Envoy’s default circuit breaker thresholds were too low for some of our workloads, causing unintended request drops. In response, we defaulted to disabling Envoy’s circuit breakers, and relied on the overload manager to protect the proxy itself. Developers could explicitly opt into load-shedding features such as adaptive concurrency to protect their services when needed.
- Request timeouts
In our system, most clients were configured to timeout before the Envoy sidecar did. This led to inconsistent error reporting: From the application’s perspective, it looked like a timeout, but from Envoy’s point of view, it often appeared as if the client abruptly closed the connection while requests were still in flight. This mismatch made debugging harder and confused developers.
- Metrics cardinality explosion
By default, Envoy exposes a rich set of metrics, but those metrics tend to scale linearly with the number of defined listeners, routes, and clusters. As more services were onboarded, we saw that metrics cost and ingestion pressure grew significantly, becoming too expensive to sustain. We’ve since started auditing high-cardinality metrics, turning off unused ones. We had to do this manually at the metrics ingestion layer because of concerns about bugs in Envoy.
- Graceful shutdown
Many clients did not proactively drain or reconnect when the DNS A records in the response changes. Instead, they rely on the server to initiate connection draining and then instruct them to disconnect. Envoy handles this behavior for our mesh-enabled services via STRICT_DNS-based service discovery, gracefully draining listeners as DNS entries change. But clients not yet onboarded to the mesh experienced a spike in unavailable errors when a dependency service restarted. These clients kept stale connections to pods that no longer existed or were in the process of terminating. To mitigate this, we added a preStop hook to the server’s Envoy sidecar container. When kubelet sends a SIGTERM, Envoy then:
- Waits 30 seconds, which is aligned with the upper bound of most services’ DNS refresh intervals;
- Sends a POST to /drain_listeners with graceful and inbound-only;
- Uses the immediate drain strategy to notify clients to close connections immediately in response headers.
- Envoy configuration update race condition
In our early file-based control plane, we updated cds.yaml and lds.yaml independently whenever their contents changed, based on md5sum. Typically, when a new egress dependency was added, both a new CDS cluster and a corresponding LDS route would be pushed around the same time. But we discovered a race condition: Sometimes the LDS update would fail or trigger a config rejection because Envoy had not yet processed or "warmed up" the newly added cluster from the CDS file. Because Envoy requires referenced clusters to be known and initialized before applying the route, this resulted in rejected routes and failed reloads.
To mitigate this, when we updated the LDS file, we waited for a second after the CDS file was updated.
- Pod stuck in initializing
During onboarding, we occasionally saw pods get stuck in the PodInitializing phase. This typically occurred when the Envoy sidecar container started before its required Envoy configuration files — such as static Envoy cluster and listener files — were available on disk. The sidecar’s postStart hook included a readiness check that waited for these files to be present; if they weren’t, the hook would hang indefinitely, causing the entire pod to remain stuck in the initializing state. This behavior was particularly confusing to users because the kubectl logs command doesn’t work for pods that haven't started running, which left operators blind to what was going wrong. Additionally, these pods were often difficult to recycle because they would also get stuck in the terminating state.
As a workaround, we relied on logs reported by our DaemonSet-based logging agent, which forwarded container logs to a central sink. This gave us visibility into the sidecar’s startup failure even when the kubectl logs command doesn’t work. We also added a timeout in the postStart hook script (here you can see a similar fix in Linkerd2) so that the pod could crash and be recycled if required files weren’t available.
- To be onboarded or Not to be onboarded
We weren’t entirely sure whether some workloads — particularly async ones — should be onboarded. Typically, these workloads read messages from Cadence (over TChannel) or Kafka, perform some computation, and write results to a database. Given the added Compute cost of the Envoy sidecar, we initially decided not to onboard them.
However, we later discovered that some of these services made gRPC calls to other critical services after reading messages, and we didn’t have a reliable way to detect that. Once we fully migrated Cadence from TChannel to gRPC — and experienced outages related to gRPC connection management — we decided to onboard all Cadence async workloads.
- Data plane upgrade
To upgrade the Envoy sidecar proxy, we had to bounce the entire application pod gradually using scripts. We later relied on the Kubernetes descheduler to enforce a maximum pod lifetime of three days, which allowed us to upgrade the sidecar gradually. The new sidecar image was rolled out cell by cell. However, this approach resulted in slower and less predictable rollouts.
We also faced challenges in developer velocity. Although developers faced new requirements, they weren’t ready for the added operational burden. We realized we had to address these velocity gaps before we began mass onboarding. Among the issues we addressed were:
- Developer confusion and onboarding gaps
Because onboarding was handled by the Infrastructure team, some developers weren’t aware their services had become mesh-enabled. While transparent onboarding sped up adoption, it also created confusion. Many developers weren’t familiar with configuring the templated Envoy configs or debugging sidecar issues.
- Overwhelming observability
Developers were overwhelmed despite our exposing extensive metrics, logs, and traces. Envoy’s metric names and structure weren’t intuitive and understanding them often required knowledge of Envoy internals. We mistakenly assumed developers shared infrastructure engineers' enthusiasm for low-level metrics, but in fact they didn’t know where to look or what to look for.
- Debugging became more complex
Ironically, introducing service mesh sometimes made debugging harder. With multiple sidecars in the call path, it was often unclear whether an issue was caused by the application, the mesh, or something else entirely. We lacked health signals for the mesh infrastructure, prompting product teams to page infrastructure engineers to assist with incident investigations.
- Resource management
The Envoy sidecar introduced new resource requirements, especially during high traffic times. When services used horizontal pod autoscaling based on average resource usage, it sometimes failed to account for sidecar resource exhaustion. This led to developers being paged for issues they couldn’t easily triage, increasing operational complexity.
- Static egress cluster definitions
Egress clusters had to be explicitly defined to enable features like zone-aware routing, circuit breaking, and even basic traffic metrics. But accurately modeling service dependencies was difficult and we lacked the tooling to generate a reliable service graph. This created friction and delayed feature adoption.
Mass adoption
After onboarding roughly 100 services, we began preparing for mass onboarding. To enable across-the-board adoption, we conducted a thorough review of our onboarding process and post-onboarding support burden. That review led to a series of critical improvements designed to streamline adoption, improve developer experience, and reduce operational overhead. The enhancements included:
- Pre-generated Envoy configs and labels
We began automatically generating Envoy configurations for all services and pre-applying mesh labels to their deployments. This significantly reduced the setup burden for each team and ensured consistency from the start.
- Shifting onboarding ownership to the Infrastructure team
We recognized that it wasn’t scalable to ask every team to follow onboarding documentation. Instead, we shifted onboarding ownership to the Infrastructure team, leaving developers responsible only for monitoring their own services during the rollout. This reduced confusion in the onboarding experience.
- Rolling update onboarding
Initially, we gradually exposed traffic by using canary deployments that ran for several days. With growing confidence in the mesh's stability and our rollback mechanisms, we switched to a gradual rolling update-based approach. By rolling update pods cell by cell, leveraging the cell-based architecture, we cut onboarding time from days to under an hour, with minimal risk.
- OpenTelemetry integration
To improve debuggability and gain visibility into service dependencies, we integrated OpenTelemetry — which delivered two major benefits.
First, spot-checking full traces often helped us debug incidents, especially when multiple services in a complex graph appeared to be failing at once.
Second, it gave us a more accurate understanding of egress dependencies. Services initially ran in HTTP passthrough mode, while tracing data was collected and ingested into ClickHouse. We then queried this data from ClickHouse to automatically generate missing egress dependencies and backfill the corresponding Envoy cluster configurations.
- Centralized resource management
The infrastructure team took responsibility for managing Envoy sidecar resource allocation, including memory and CPU tuning. Additionally, we removed CPU limits for the Envoy sidecar container. All pages related to Envoy resource issues were routed to the Infrastructure team, allowing developers to focus on their application logic rather than proxy tuning.
- Expand the team size
As the service mesh became increasingly critical at DoorDash, we grew the team from around two to eight engineers by bringing in teammates who had previously focused on north-south traffic. This consolidation improved support capacity and established clearer, more unified ownership across all layers of traffic.
Although these improvements didn’t resolve every issue we encountered, we concluded that the benefits of onboarding all services to the mesh outweighed any remaining risks. We wanted to complete the migration and unlock a powerful platform so that we could keep delivering new features to our customers while continuously improving the developer experience.
Things were going well as we began executing on our full adoption plan. We encountered several issues that, while technically unexpected, had been anticipated, resulting in two or three incidents. Fortunately, we were able to roll back fast enough before any situation went off the rails. Today, during peak hours, the service mesh at DoorDash supports and empowers over 80 million requests per second.
Lessons learned
We hope our experience migrating to a service mesh architecture can inspire and support others as they begin their own journey. To summarize, here are some of the key takeaways we’d like to highlight:
- Stay grounded in real problems. Service mesh is a broad, complex space that spans many infrastructure domains. For lean organizations, it’s important to stay focused on why you’re making the transition. Identify the real-world problems it may help resolve so that service mesh can deliver the most value to your engineering teams.
- Expect the unexpected. Despite best intentions, the additional Envoy proxy can introduce subtle behaviors that aren’t always easy to debug. Be ready for edge cases, especially early in adoption. You may uncover many unknowns along the way. Start small, partner with pilot teams, and test incrementally.
- Move fast when it matters. Take bets when it’s time. Sometimes, shipping early — even with imperfections — is necessary to unlock long-term progress.
- Manual onboarding doesn't scale. Automate wherever possible to avoid bottlenecks.
- Developer education is essential, but not scalable. Make things intuitive by design and invest in UX-focused tools to improve experience.
- Envoy metrics can be overwhelming. The telemetry data could be powerful but difficult for many developers to interpret — and sometimes expensive to store and process.
- Managing Envoy configuration is complex. Without the right abstractions, writing and maintaining Envoy config is unsustainable.
Acknowledgements
We couldn’t have finished Part 1 of DoorDash’s service mesh story without the incredible contributions across the engineering organization. Special thanks to Ivar Lazzaro, Jonathan Shih, Kevin Wang, Brian Lu, Amit Gud, Luigi Tagliamonte, Saso Matejina, Levon Stepanian and Sebastian Yates for their support and contributions in various forms.
We’re also deeply grateful to the current traffic team — Darshit Gavhane, Jon Yücel, Ethaniel Rubio, Ravi Kodippili, Xuanmin Zhu, Abhishek Rao and Joanna Baranowski — who have continued to help maintain, scale, and evolve the architecture over the past two years.
What’s next
In upcoming posts, we’ll cover more recent advancements, including new features we are building, how we redesigned DoorDash’s multi-cluster service discovery, and how we evolved the mesh architecture to further consolidate DoorDash’s traffic infrastructure and better support developer velocity at scale.