





How we built a measurement layer that tells us where, why, and how much to trust an agentic code reviewer, and why a single metric never could.
In a nutshell
DoorDash recently described how we built a production code review agent that engineers actually listen to. That post covered the product and architecture choices behind the agent: a lead scout, deep reviewers, focused context, a precision-over-recall posture, and a model-agnostic design. DashBench is our measurement layer behind it. DashBench replays historical PRs and evaluates whether systems surface real, human-actionable findings instead of merely producing plausible comments. That distinction matters because convenient signals like acceptance rate, thumbs-up feedback, or a single aggregate score can make a reviewer look useful while hiding where it fails: missing important issues, over-indexing on easy comments, or trading recall for precision in ways product metrics do not expose.
The headline result: on the 105-case report, DoorDash's production code reviewer (Claude Sonnet 4.6 high scout + Claude Opus 4.8 high reviewer) found 504 real findings with 53.6% weighted recall, compared with 164 real findings and 30.7% weighted recall for a no-scout GPT 5.5 high baseline. The broader model-mix view is more interesting than a single winner: Kimi K2.6 scout + Claude Fable 5 reviewer led weighted recall and F1, Composer 2.5 scout + GPT 5.5 medium reviewer led weighted precision, and the single-pass baselines stayed much cheaper.
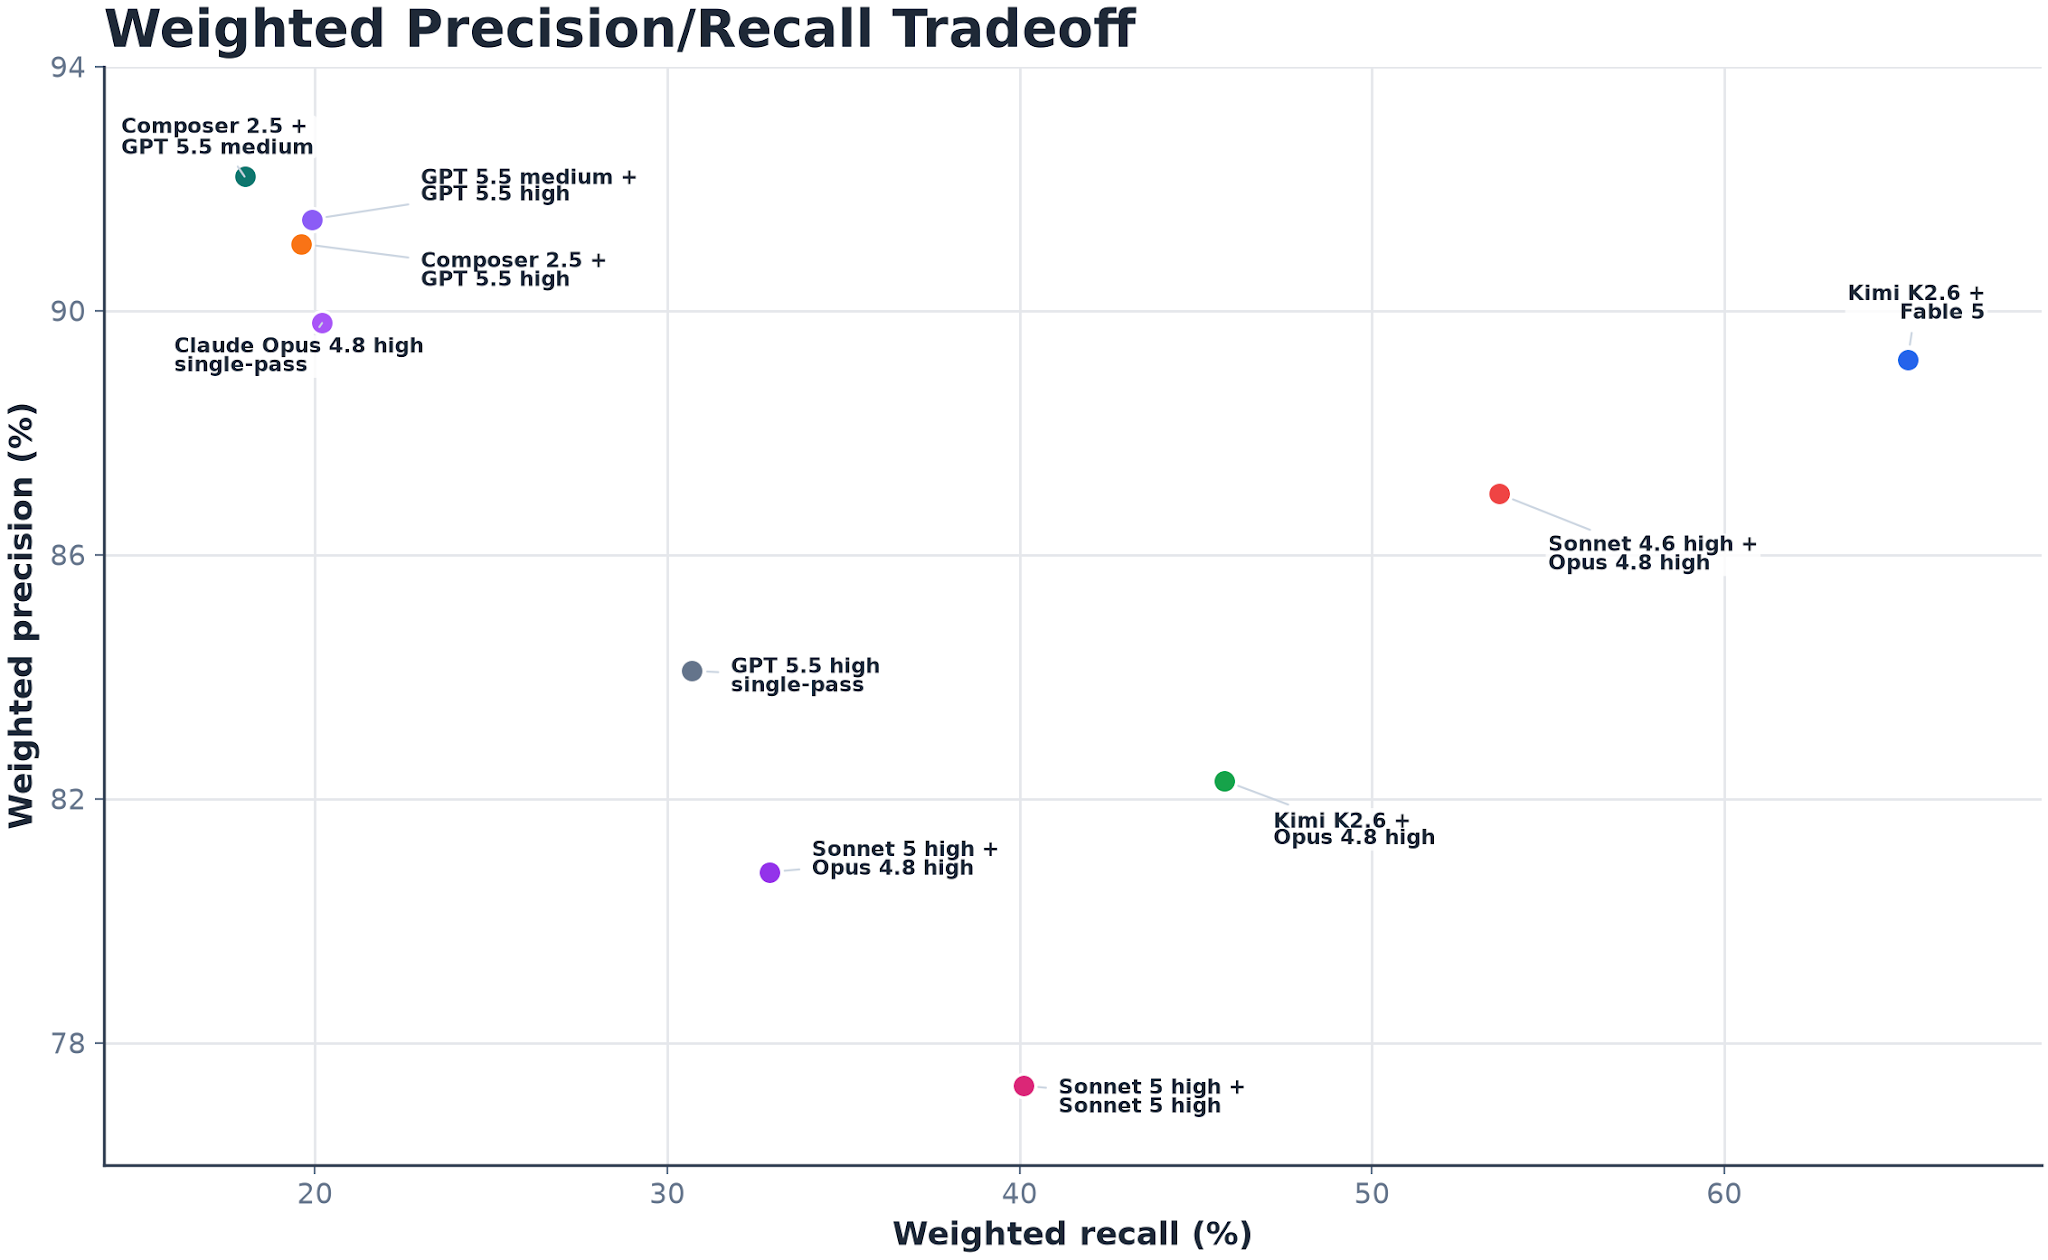
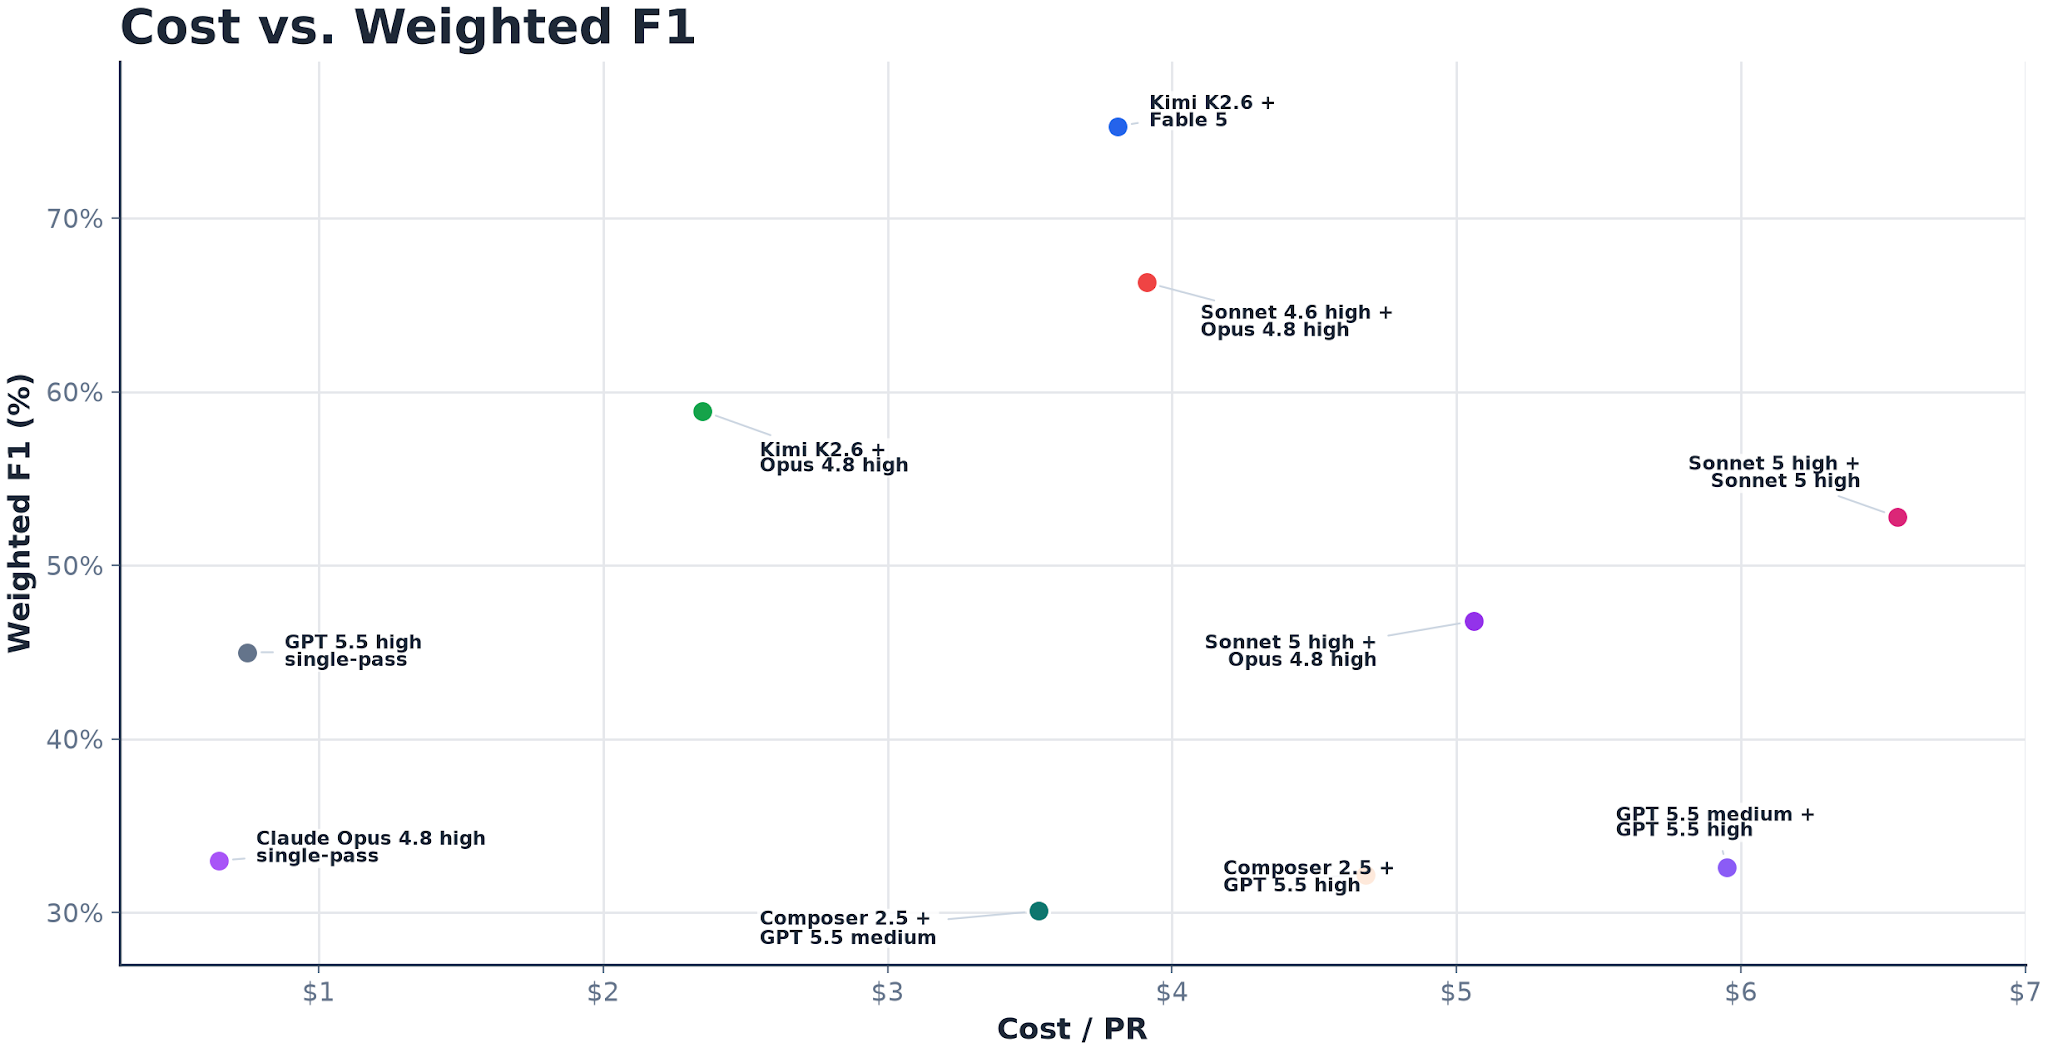
Note: Weighted metrics give more weight to higher-severity issues (critical = 4, high = 2, medium = 1, low = 0.5).
Why the obvious signals lie
The tempting way to measure a code reviewer – and the main metric most major code review tools use today – is to watch what happens in production: do authors accept its comments, do they act on them? That signal is real. But it’s built on a foundation of shaky assumptions and incomplete information. In the language of confusion matrices, acceptance only ever populates two of the four cells: a comment the author accepts is booked as a true positive (TP), one they reject as a false positive (FP). Both bookings assume the human's call is ground truth – that engineers are infallible, or at least they’re wrong rarely and randomly enough that the errors don't matter in aggregate. As we'll see, that's a bad bet.
The other two cells stay empty, and that's the real cost. Acceptance can't record false negatives (bugs the reviewer missed) or true negatives (clean code where silence was the right answer). It tells you something happened; it doesn't tell you whether the review was right, whether silence was justified, or what gets missed. DashBench handles that differently: after adjudication, missed real issue clusters count as false negatives for benchmark scoring, even though production acceptance telemetry cannot observe them.
The other problem alluded to above is that human acceptance is a useful signal, but not ground truth. Authors accept and reject comments for product and workflow reasons: timing, PR urgency, ownership context, how invasive the fix is, or whether the issue was already handled another way. That makes acceptance a valuable product telemetry, but a weak benchmark label by itself. In disagreement audits, human review and agentic verification both surfaced mistakes; the point was not to declare one side right, but to separate "was accepted" from "was real." The most available metric can still point at the wrong target.
That’s the reason we built DashBench. If we lean on the convenient metric to build and improve a system our engineers now depend on, we would optimize confidently towards a foundationally flawed objective. The fix isn't a better single metric. It's a benchmark that triangulates across several flawed signals and never relies on any one of them as the ground truth.
From a production architecture to a clean place to measure
Our production reviewer uses a staged architecture that separates noticing from verifying. A lead scout reads the change and flags suspicious areas. Deep reviewers then investigate the strongest leads, confirm whether each concern holds up, and drop the claims that don't survive scrutiny. It mirrors how strong human reviewers work: form hunches, aim attention at the risky parts of the diff, then validate before asking an author to do anything.
That design happens to give us a clean evaluation surface. Because the workflow is model-agnostic, every component is a variable we can hold fixed or change on its own: the scout model, the reviewer model, the context policy, the tool policy, the runtime budget. We can replay the same frozen PRs through the production agent, through staged variants with different model assignments, and through plain single-pass reviewers, and the thing being measured stays constant.
So the useful question stops being "which model is best?" It becomes: for a given architecture, context policy, tool policy, runtime budget, and model mix, what tradeoff between coverage, precision, cost, and latency do we actually get, and where does it fail? "Best" is meaningless until you say best at what, on which cases, at what cost.
How we built the benchmark
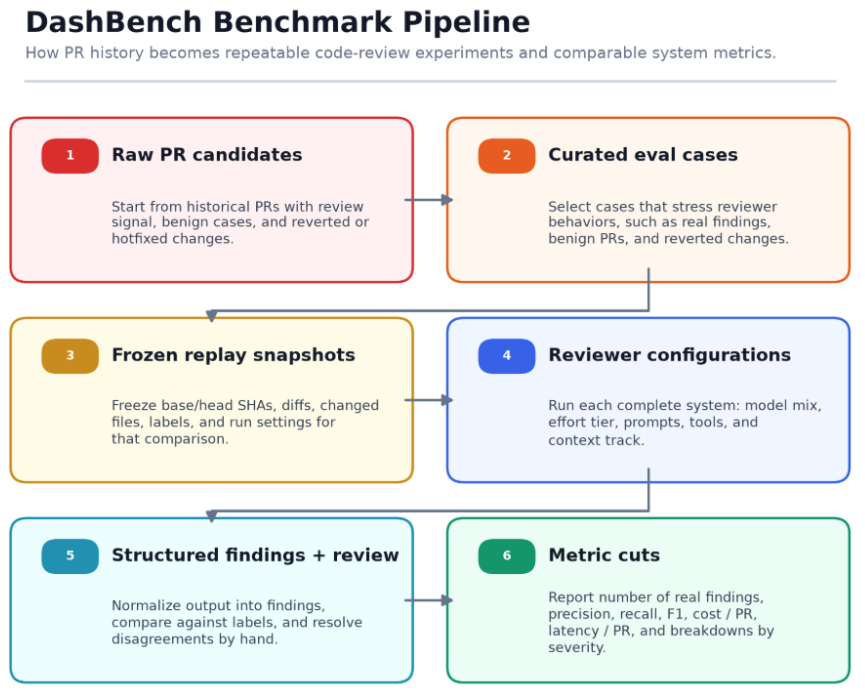
The important part is the loop, not any single box. New cases and model changes keep entering the same replay-and-score path, while disagreement review keeps the benchmark honest when human feedback, production behavior, and agentic judgment do not line up. In that pass, we manually inspect the evidence, decide whether the finding is real, and feed the resolved cases back into judge calibration. The judge itself is LLM-based, but DashBench treats it as a calibrated signal, not ground truth.
The cases.
DashBench started from roughly 1,000 raw PR candidates and was curated toward cases that stress different review behaviors, such as tricky diffs, noisy review histories, and varied severity outcomes. The post uses the 105-case valid report to analyze staged-versus-single-pass systems, scout/reviewer model choices, and severity-weighted quality on one consistent eval slice.
- Historical PRs with real review findings and enough surrounding context to faithfully replay the review.
- Benign PRs with close to zero real findings, so the benchmark can measure restraint and catch false positives; a reviewer that's loud on clean code is its own failure mode.
- PRs that were later reverted or hotfixed, so the benchmark can test whether a system catches genuine code-level regressions before merge.
The labels.
This is where most benchmarks cut a corner we refused to. Preparing labels took more than importing human feedback. We had the engineers who wrote the PRs annotate candidate findings, then compared three sources against each other: the human annotations, the original candidate findings, and an agentic judge. Human feedback was valuable but frequently wrong: reviewers missed valid issues, accepted weak claims, or read a historical PR's context differently than the next reviewer would. Where the three sources disagreed, we re-reviewed the evidence by hand and resolved it, and those resolved cases became calibration data for the judge.
The result is a benchmark whose ground truth doesn't rest on any single fallible source. Human judgment, production feedback, and agentic evaluation each contribute; none is treated as infallible.
The execution environment.
Within a comparison, every configuration runs against the same frozen case set, context track, prompt and skill-pack selection, normalized output contract, and grading pipeline. The harness is part of what we are measuring: profiles differ in runner kind, scout/reviewer models, tool surface, context mechanics, and provider limits. Some run from a prepared repo with read/grep-style tools, some receive bounded repo context in the prompt, and some disable search or judge steps in the review run. Cost, latency, timeouts, retries, and failures are recorded in the run artifacts and suite summaries rather than treated as controlled constants. The point is repeatability: when a number moves, we want to know whether it moved because the model or harness changed, not because the eval drifted.
The Report: What DashBench actually shows
We use DashBench to answer four questions that production telemetry alone cannot answer. First, does staging actually buy coverage? Second, which scout/reviewer model choices change the cost, precision, and recall frontier? Third, do the headline rankings survive when we split findings by severity? Fourth, when do staged scout/reviewer setups beat stronger single-pass reviewers, and what do they give up to do it?
Staging benefits
Staging buys coverage, and the price is visible. On the 105-case report, DoorDash's production code reviewer (Claude Sonnet 4.6 high scout + Claude Opus 4.8 high reviewer) found 504 real findings with 53.6% weighted recall, compared with 164 real findings and 30.7% weighted recall for the no-scout GPT 5.5 high baseline. Weighted precision stayed in the same neighborhood, 87.0% versus 84.1%, but the production reviewer cost more per PR and took longer. That is exactly the kind of result we want DashBench to surface: not a trophy, but a measured tradeoff.
| System | Real findings | Weighted precision | Weighted recall | Cost / PR |
|---|---|---|---|---|
| DoorDash production code reviewer | 504 | 87.0% | 53.6% | $3.91 |
| No scout + GPT 5.5 high reviewer | 164 | 84.1% | 30.7% | $0.75 |
| No scout + Claude Opus 4.8 high reviewer | 115 | 89.8% | 20.2% | $0.65 |
Scout/reviewer model choice
The model-mix comparison is where the benchmark becomes most useful: we swap which model scouts and which model reviews while keeping the benchmark fixed. No configuration dominates every axis. Kimi K2.6 scout + Claude Fable 5 reviewer had the strongest weighted recall and F1 on the 105-case valid subset, at 65.2% weighted recall and 75.3% weighted F1. Composer 2.5 scout + GPT 5.5 medium reviewer had the strongest weighted precision at 92.2%, but with materially lower recall. The no-scout baselines were cheaper, while Kimi K2.6 scout + Claude Opus 4.8 high reviewer was a lower-cost staged alternative with materially lower recall.
| Configuration | Real findings | Weighted precision | Weighted recall | Weighted F1 | Cost / PR |
|---|---|---|---|---|---|
| Kimi K2.6 scout + Claude Fable 5 reviewer | 537 | 89.2% | 65.2% | 75.3% | $3.81 |
| Claude Sonnet 4.6 high scout + Claude Opus 4.8 high reviewer | 504 | 87.0% | 53.6% | 66.3% | $3.91 |
| Kimi K2.6 scout + Claude Opus 4.8 high reviewer | 396 | 82.3% | 45.8% | 58.9% | $2.35 |
| Claude Sonnet 5 high scout + Claude Sonnet 5 high reviewer | 321 | 77.3% | 40.1% | 52.8% | $6.55 |
| Claude Sonnet 5 high scout + Claude Opus 4.8 high reviewer | 226 | 80.8% | 32.9% | 46.8% | $5.06 |
| GPT 5.5 medium scout + GPT 5.5 high reviewer | 276 | 91.5% | 19.9% | 32.6% | $5.95 |
| Composer 2.5 scout + GPT 5.5 high reviewer | 267 | 91.1% | 19.6% | 32.2% | $4.68 |
| Composer 2.5 scout + GPT 5.5 medium reviewer | 246 | 92.2% | 18.0% | 30.1% | $3.53 |
| No scout + GPT 5.5 high reviewer | 164 | 84.1% | 30.7% | 45.0% | $0.75 |
| No scout + Claude Opus 4.8 high reviewer | 115 | 89.8% | 20.2% | 33.0% | $0.65 |
Impact of severity of findings on evaluation
Severity changes the story again. Across the 105-case valid subset, the union of adjudicated real findings contains 40 critical, 136 high, 271 medium, and 385 low clusters. Kimi K2.6 scout + Claude Fable 5 reviewer was strongest on critical, high, and medium coverage, while Claude Sonnet 4.6 high scout + Claude Opus 4.8 high reviewer covered slightly more of the low-severity tail. The no-scout GPT 5.5 high row was cheap and still useful on high-severity issues, but weaker on overall coverage. This is why the weighted score exists: it gives critical and high-severity misses more pull than low-severity misses, while still letting us inspect the full severity split.
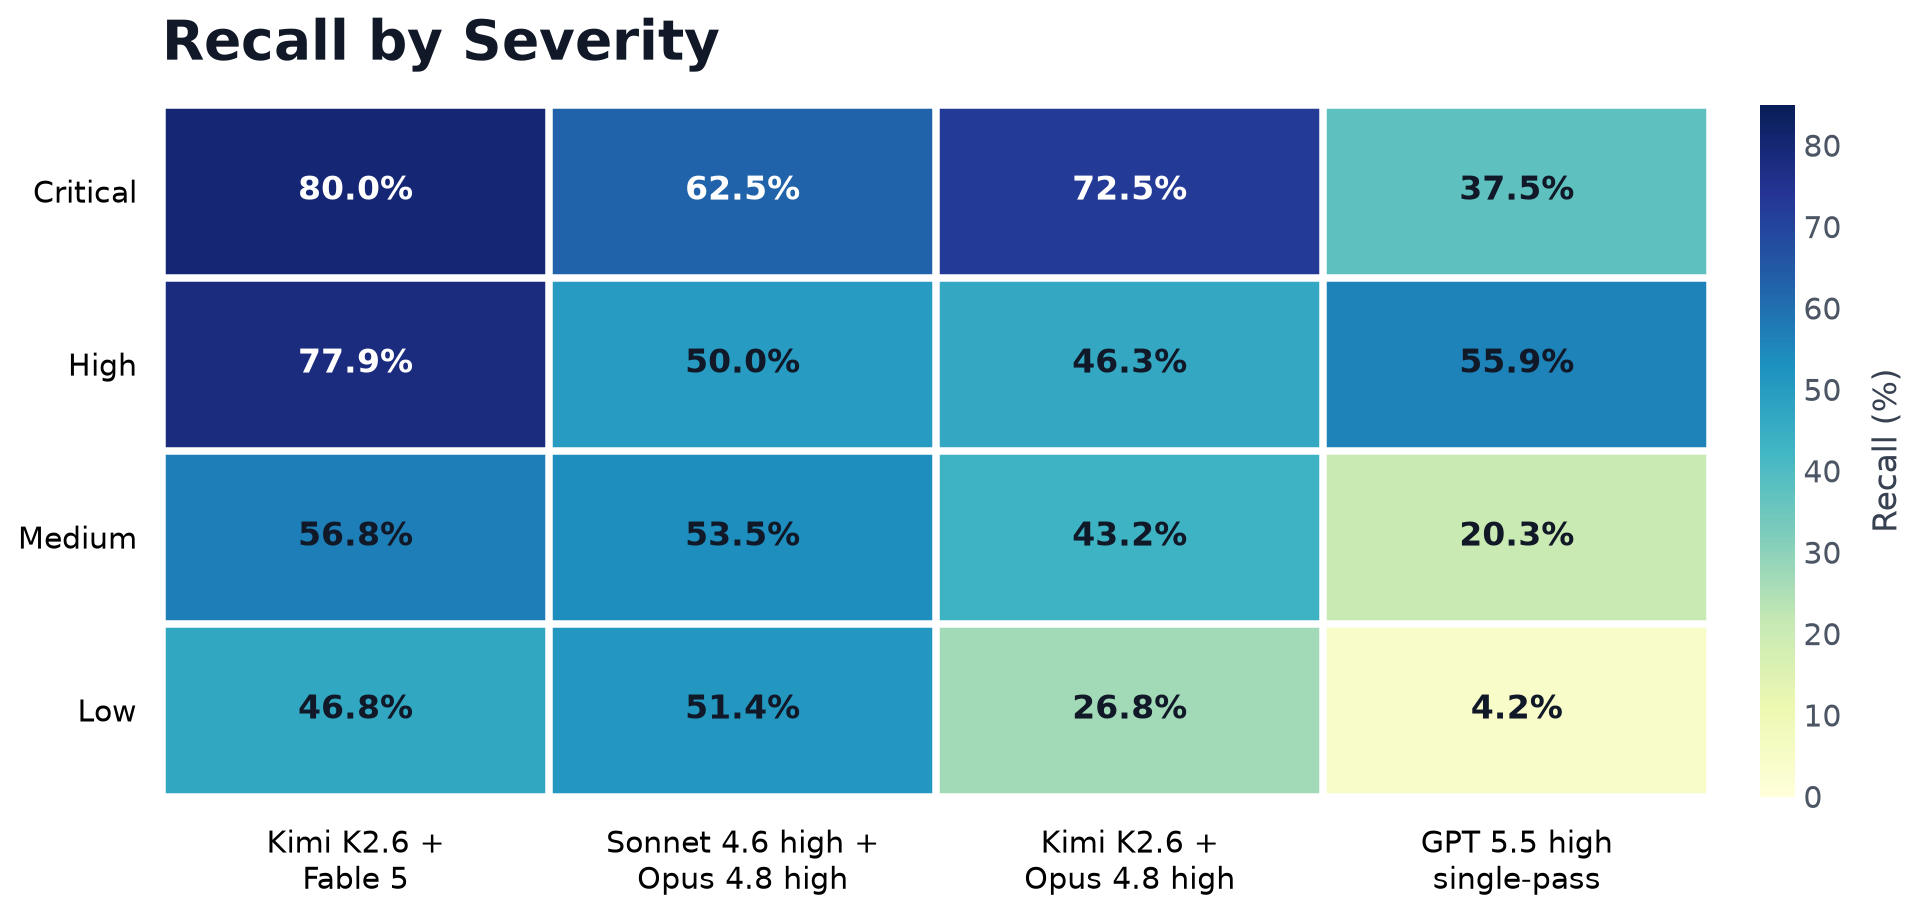
The severity view shows why one score is not enough: configurations that look close overall miss very different kinds of issues.
Influence of model quality and size on benchmark results
The model-mix data says the same thing in numbers: Kimi K2.6 scout + Claude Fable 5 reviewer leads weighted recall and F1, Composer 2.5 scout + GPT 5.5 medium reviewer leads weighted precision, and the single-pass no-scout baselines stay cheaper while giving up coverage. Purpose-built staging does not make a weaker model magically best at everything; it changes the shape of the tradeoff. Scouts improve breadth when the reviewer can verify aggressively. Stricter reviewer configurations improve precision when the business goal is to reduce noise. Single-pass no-scout baselines are a useful lower-cost floor, but they leave coverage on the table. The result is not that one model wins. The result is that no single configuration dominates, and being able to say exactly that is the point.
Lessons from benchmarking PR reviewing
Trust must be earned. No single signal is a reliable source of truth for real-world benchmarking. Human labels, production acceptance, and agentic judgment each contributed, and each was wrong often enough that treating any one as ground truth would have quietly poisoned the scores. The benchmark is only as good as its refusal to trust any fallible input alone.
Humans don't scale. Human attention for labeling degrades fast on complex tasks, and faster across many of them, even when the labeler is the same engineer who wrote or reviewed the original PR. AI judging is what makes labeling at this scale tractable at all, but only under the constraints in the next two lessons.
Variance is a feature, not a bug. LLMs are non-deterministic, so multiple runs of the same agent surface additional valid findings, meaning a single run understates an agent's real coverage, and you have to run repeatedly and aggregate to score it honestly. The same stochasticity applies to the judge: deterministic matching is stable but misses semantic equivalence, while LLM judges reason more richly but need calibration, audit sets, and stable rubrics to stay trustworthy. The whole measurement stack is stochastic; the work is designing for that instead of pretending it away.
When one metric can't work, look to many. A single score is misleading by construction. Weighted precision, weighted recall, weighted F1, not-real findings, high/critical recall, latency, and cost all move independently; a system can win one and lose another in the same run, so "better" is meaningless until you say better at what.
Stay Informed with Weekly Updates
Subscribe to our Engineering blog to get regular updates on all the coolest projects our team is working on
Please enter a valid email address.
Thank you for Subscribing!
What's next
DashBench exists so we can keep improving the reviewer with evidence instead of anecdotes. The goal was never a static leaderboard; it's a feedback loop where every material change to model, prompt, context, tool use, workflow, or runtime budget gets tested the same real PR-review cases before it reaches an engineer.
The next stretch is continuous benchmarking:
- New models and harnesses enter the benchmark quickly as they ship, including additional agent harnesses we have planned for this stage.
- Stale PR cases retire from the dataset while new cases are added continuously, so the benchmark tracks the codebase instead of drifting away from it.
- We're moving from a single judge to an agentic jury, to mitigate bias between individual judge models.
- We're benchmarking against external code-review solutions, not just internal variants.
And we're starting to benchmark coding agents, not just reviewers, on a real enterprise codebase with real tasks and features. More on that later.
The honest summary is this: making an AI system useful is only half the work. The harder part is knowing where it fails, why it fails, and whether the next change made it better or just different. Most of the field is still measuring the wrong unit with the wrong number. DashBench is our attempt to measure the work that actually matters: real findings, on real PRs, with the tradeoffs left visible. If that is the kind of problem you want to work on, we'd like to talk.
Appendix
Parking lot for detail that backs the post without slowing the body down. The Report section keeps the reader on the tradeoffs; this section keeps the audit trail.
A. Execution environment (full spec). Within a comparison, each configuration runs on the same dataset cut and produces the same structured finding contract: severity, evidence, and file anchors. The harness itself is part of what DashBench measures, so profiles can differ in runner kind, scout/reviewer split, model choice, tool surface, context mechanics, and provider limits. Scoring then uses the same matching path for that comparison, with deterministic matching where possible and agentic judging where semantic matching is needed. The point is not to erase system differences; it is to make those differences explicit enough that cost, latency, and quality move for interpretable reasons.
B. Dataset and eval-set sizes. DashBench started from roughly 1,000 raw PR candidates, then narrowed to cases that could be replayed and adjudicated. The post uses the 105-case valid report for the main model-mix and staged-versus-single-pass analysis. The severity denominator in that 105-case cut is the union of real finding clusters: 40 critical, 136 high, 271 medium, and 385 low. Those are finding clusters, not PR counts; one PR can contribute more than one cluster.
C. Full configuration metrics. The body shows the narrow version because that is the readable version. The full metrics are below for auditability, split so they stay on the page.
| Metric | DoorDash production code reviewer | No scout + GPT 5.5 high reviewer |
|---|---|---|
| Setup | Claude Sonnet 4.6 high scout + Claude Opus 4.8 high reviewer | Single reviewer |
| Raw findings | 611 | 200 |
| Real findings | 504 | 164 |
| Weighted precision | 87.0% | 84.1% |
| Weighted recall | 53.6% | 30.7% |
| Weighted F1 | 66.3% | 45.0% |
| High/critical recall | 52.8% | 51.7% |
| Cost / PR | $3.91 | $0.75 |
| Cost / real finding | $0.82 | $0.48 |
| Review latency / PR | 725.0s | 170.3s |
| Caveat | Higher cost and latency, but broader coverage | Lower cost and latency, but much lower overall recall |
| Configuration | Findings | Quality | Cost / latency |
|---|---|---|---|
| Kimi K2.6 scout + Claude Fable 5 reviewer | 669 raw 537 real 132 not real | 89.2% precision 65.2% recall 75.3% F1 | $3.81 / PR $0.75 / real 589.3s / PR Best weighted recall/F1 |
| Claude Sonnet 4.6 high scout + Claude Opus 4.8 high reviewer | 611 raw 504 real 107 not real | 87.0% precision 53.6% recall 66.3% F1 | $3.91 / PR $0.82 / real 725.0s / PR |
| Kimi K2.6 scout + Claude Opus 4.8 high reviewer | 574 raw 396 real 178 not real | 82.3% precision 45.8% recall 58.9% F1 | $2.35 / PR $0.62 / real 263.9s / PR Fastest measured staged setup |
| Claude Sonnet 5 high scout + Claude Sonnet 5 high reviewer | 509 raw 321 real 187 not real 1 unclear | 77.3% precision 40.1% recall 52.8% F1 | $6.55 / PR $2.14 / real 657.9s / PR |
| Claude Sonnet 5 high scout + Claude Opus 4.8 high reviewer | 327 raw 226 real 100 not real 1 unclear | 80.8% precision 32.9% recall 46.8% F1 | $5.06 / PR $2.35 / real 565.3s / PR |
| GPT 5.5 medium scout + GPT 5.5 high reviewer | 332 raw 276 real 56 not real | 91.5% precision 19.9% recall 32.6% F1 | $5.95 / PR $2.26 / real 619.5s / PR |
| Composer 2.5 scout + GPT 5.5 high reviewer | 324 raw 267 real 57 not real | 91.1% precision 19.6% recall 32.2% F1 | $4.68 / PR $1.84 / real 539.2s / PR |
| Composer 2.5 scout + GPT 5.5 medium reviewer | 285 raw 246 real 39 not real | 92.2% precision 18.0% recall 30.1% F1 | $3.53 / PR $1.50 / real 429.4s / PR Best weighted precision |
| No scout + GPT 5.5 high reviewer | 200 raw 164 real 36 not real | 84.1% precision 30.7% recall 45.0% F1 | $0.75 / PR $0.48 / real 170.3s / PR |
| No scout + Claude Opus 4.8 high reviewer | 134 raw 115 real 19 not real | 89.8% precision 20.2% recall 33.0% F1 | $0.65 / PR $0.60 / real 112.8s / PR |
D. Severity breakdown (full). The severity view is the clearest reason the weighted headline metric exists. Critical and high misses are not interchangeable with low-severity misses, and the configurations move differently by tier.
Recall by severity
| Severity | Union real clusters | Kimi K2.6 + Fable 5 | Sonnet 4.6 high + Opus 4.8 high | Kimi K2.6 + Opus 4.8 high | GPT 5.5 high |
|---|---|---|---|---|---|
| Critical | 40 | 80.0% | 62.5% | 72.5% | 37.5% |
| High | 136 | 77.9% | 50.0% | 46.3% | 55.9% |
| Medium | 271 | 56.8% | 53.5% | 43.2% | 20.3% |
| Low | 385 | 46.8% | 51.4% | 26.8% | 4.2% |
Precision by severity
| Severity | Kimi K2.6 + Fable 5 | Sonnet 4.6 high + Opus 4.8 high | Kimi K2.6+ Opus 4.8 high | GPT 5.5 high |
|---|---|---|---|---|
| Critical | 100.0% | 100.0% | 100.0% | n/a |
| High | 96.0% | 95.6% | 94.9% | 86.9% |
| Medium | 94.2% | 87.8% | 86.8% | 80.9% |
| Low | 65.3% | 76.8% | 49.7% | 70.4% |
Task intents are multi-label, so counts sum to more than 105.
Task intents
| Task intent | Count | Percent of cases |
|---|---|---|
| tests | 90 | 85.7% |
| config_build | 85 | 81.0% |
| feature | 41 | 39.0% |
| api_schema | 33 | 31.4% |
| docs_kb | 20 | 19.0% |
| dependency_tooling | 19 | 18.1% |
| bug_fix | 18 | 17.1% |
| data_model | 15 | 14.3% |
| refactor_cleanup | 15 | 14.3% |
| ui | 10 | 9.5% |
| rollout_guard | 9 | 8.6% |
| security_privacy | 8 | 7.6% |
| observability | 7 | 6.7% |
| performance | 6 | 5.7% |
| behavior_change | 1 | 1.0% |
PR change size
| PR size class | Count | Percent of cases |
|---|---|---|
| large | 36 | 34.3% |
| medium | 36 | 34.3% |
| small | 33 | 31.4% |
Verifiability
| Verifiability | Count | Percent of cases |
| medium | 54 | 51.4% |
| strong | 38 | 36.2% |
| weak | 13 | 12.4% |
Product domains
Top 20 domains are shown.
| Product domain | Count | Percent of cases |
|---|---|---|
| consumer_feed | 18 | 17.1% |
| campaign_supply | 6 | 5.7% |
| logistics_labor | 5 | 4.8% |
| order_cart | 5 | 4.8% |
| support_support_funnel | 4 | 3.8% |
| fraud_risk_core | 3 | 2.9% |
| logistics_fulfillment | 3 | 2.9% |
| money_payin | 3 | 2.9% |
| consumer_discoverycontent | 2 | 1.9% |
| helios | 2 | 1.9% |
| merchant_mdh | 2 | 1.9% |
| merchant_orders | 2 | 1.9% |
| merchant_support | 2 | 1.9% |
| merchant_user_management_service | 2 | 1.9% |
| platform_pretzel | 2 | 1.9% |
| public | 2 | 1.9% |
| repo_config | 2 | 1.9% |
| support_automation_ai_agent | 2 | 1.9% |
| support_voice | 2 | 1.9% |
| tools | 2 | 1.9% |
Impact
Impact labels are multi-label, so counts sum to more than 105.
| Impact | Count | Percent of cases |
|---|---|---|
| customer_facing | 34 | 32.4% |
| merchant_ops | 33 | 31.4% |
| infra_reliability | 30 | 28.6% |
| logistics | 22 | 21.0% |
| data_integrity | 18 | 17.1% |
| developer_knowledge | 16 | 15.2% |
| unknown | 16 | 15.2% |
| test_quality | 9 | 8.6% |
| security_privacy | 8 | 7.6% |
| money | 7 | 6.7% |