




The DoorDash Data team is responsible for generating accurate data insights and answers to key business questions:
- Why did the order volume dip in California last week?
- How has a new product been pacing since launch?
- Which merchants are at risk of churning from our marketing products?
- Show me canceled orders by hour for the last 90 days at Arby’s
Frontier agentic models combined with agent harnesses such as Codex and Claude Code (CC) are powerful tools for interacting with our data and answering such questions. However, they often perform suboptimally when facing the large semi-structured data footprint common in large-scale companies. It is a challenge to ensure that all business functions — including operations, engineering, marketing, and product — have access to current, correct data from which they may draw the right conclusions.
"The problem is actually that our upstream data sources are super-fragmented," noted a senior analytics manager looking at our previous tools. Those tools were either deep in one domain or broad and shallow.
As a result, we built Vera, an internal conversational data agent. We found that building and tuning all parts of the pipeline — prompting, ranking and retrieval, and domain-specific skills — led to significant performance improvements over standard agents with simple data connectors. "It has worked well for strategic finance questions across difficulty levels. I've been very impressed,” said a finance director after several weeks of testing Vera.
Why we built in-house
Contemporary agents generally can answer data questions in a clean environment. But a strong semantic data layer is key to ensuring these agents pull truthful answers that the business can trust. Disambiguating and deconflicting semantic meaning across the organization is not trivial; it’s a pressing challenge to grow this data layer while maintaining accuracy.
The key to scaling Vera, in our view, is to let domain owners — the people closest to the data — contribute and vet evals. A domain owner is the subject-matter expert accountable for how a business area is measured. Building that tight loop is easier when we have firm control over the stack.
In this post, we step through Vera’s overall design and performance measurements, discussing architectural choices and providing comparative studies across model types and reasoning efforts.
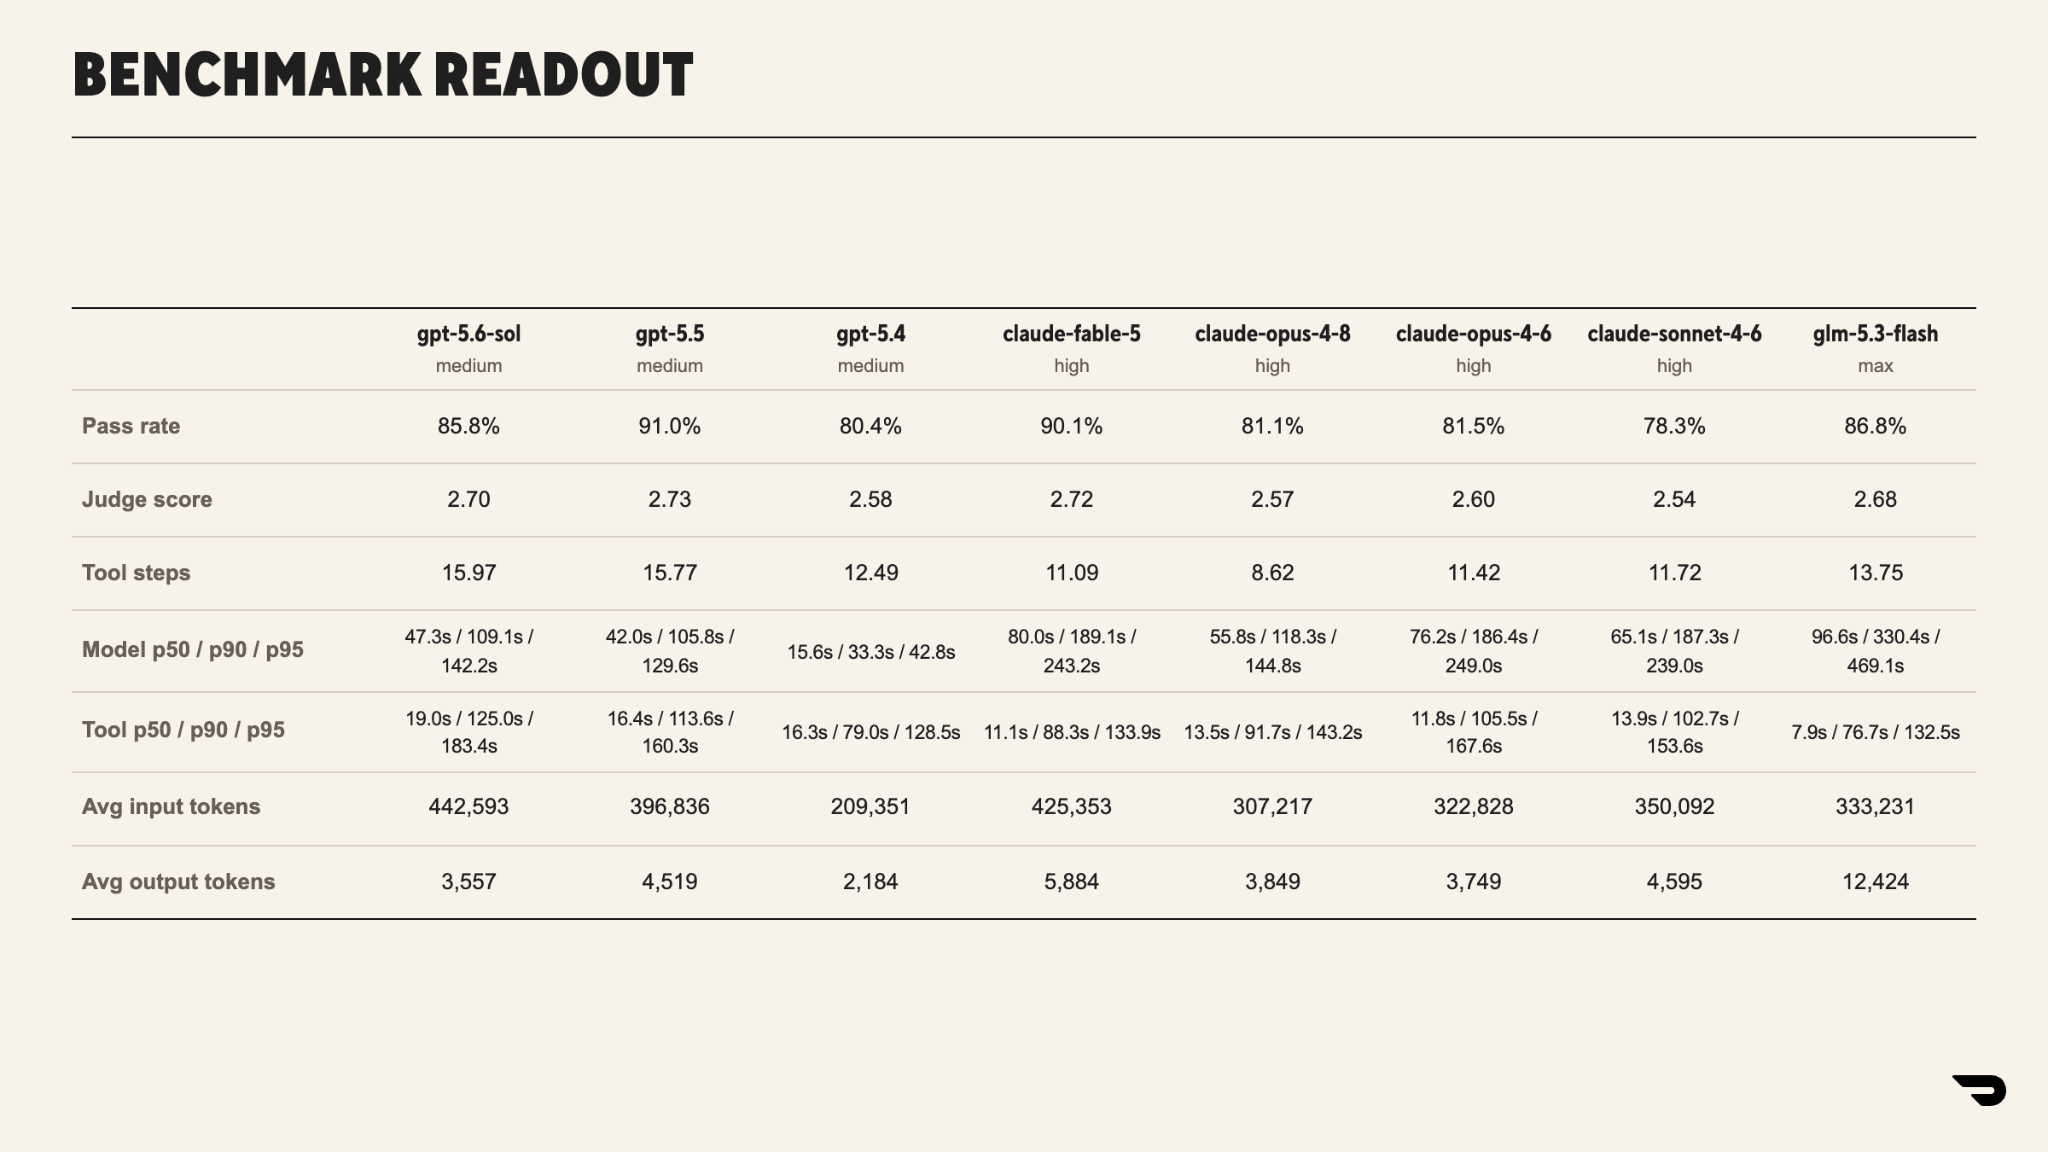
Our evaluation dataset spans 19 vertical domains across sales, finance, product, and operational domains at DoorDash with more than 1,900 contributed evaluations. These vary in complexity, with some questions requiring many tool calls and extended reasoning.
The current production model - GPT 5.5 - scores highest overall on the benchmark. This is unsurprising as we have optimized prompts and skills for this model specifically, which we aim to replicate across model families soon.
The final responses are scored with an LLM judge across three criteria: tool usage, table selection, and overall answer correctness. Where evals do not have an unambiguous SQL-backed query, domain experts provide detailed judging rubrics. The maximum score in this design is 3.0; as Table 1 shows, the frontier models from both Anthropic and OpenAI land within a few points of each other.
We also report tool calls and completion rates. Because the models author their own SQL, a full run fires many concurrent heavy queries. Some hit database timeouts which count as failures in the pass rate, not as wrong answers.
The run-to-run spread of the benchmark is roughly four percentage points of pass rate, independent of the model; differences smaller than that are considered noise. One contributor keeps the evaluations themselves current. An eval that specifies a relative time window — for instance, “What was the order throughput of this store last week?” — goes stale quickly.
While frontier models perform well with our harness on this benchmark, there are different trade-off considerations for latency, tool-use, and cost depending on the model and provider. We choose Vera’s production model on that trade-off rather than on the headline score alone, re-running the benchmark as new models ship. These ablations run on a 100-question subset, so differences of a few points are within our definition of noise. Across model types, more reasoning effort improves the score.
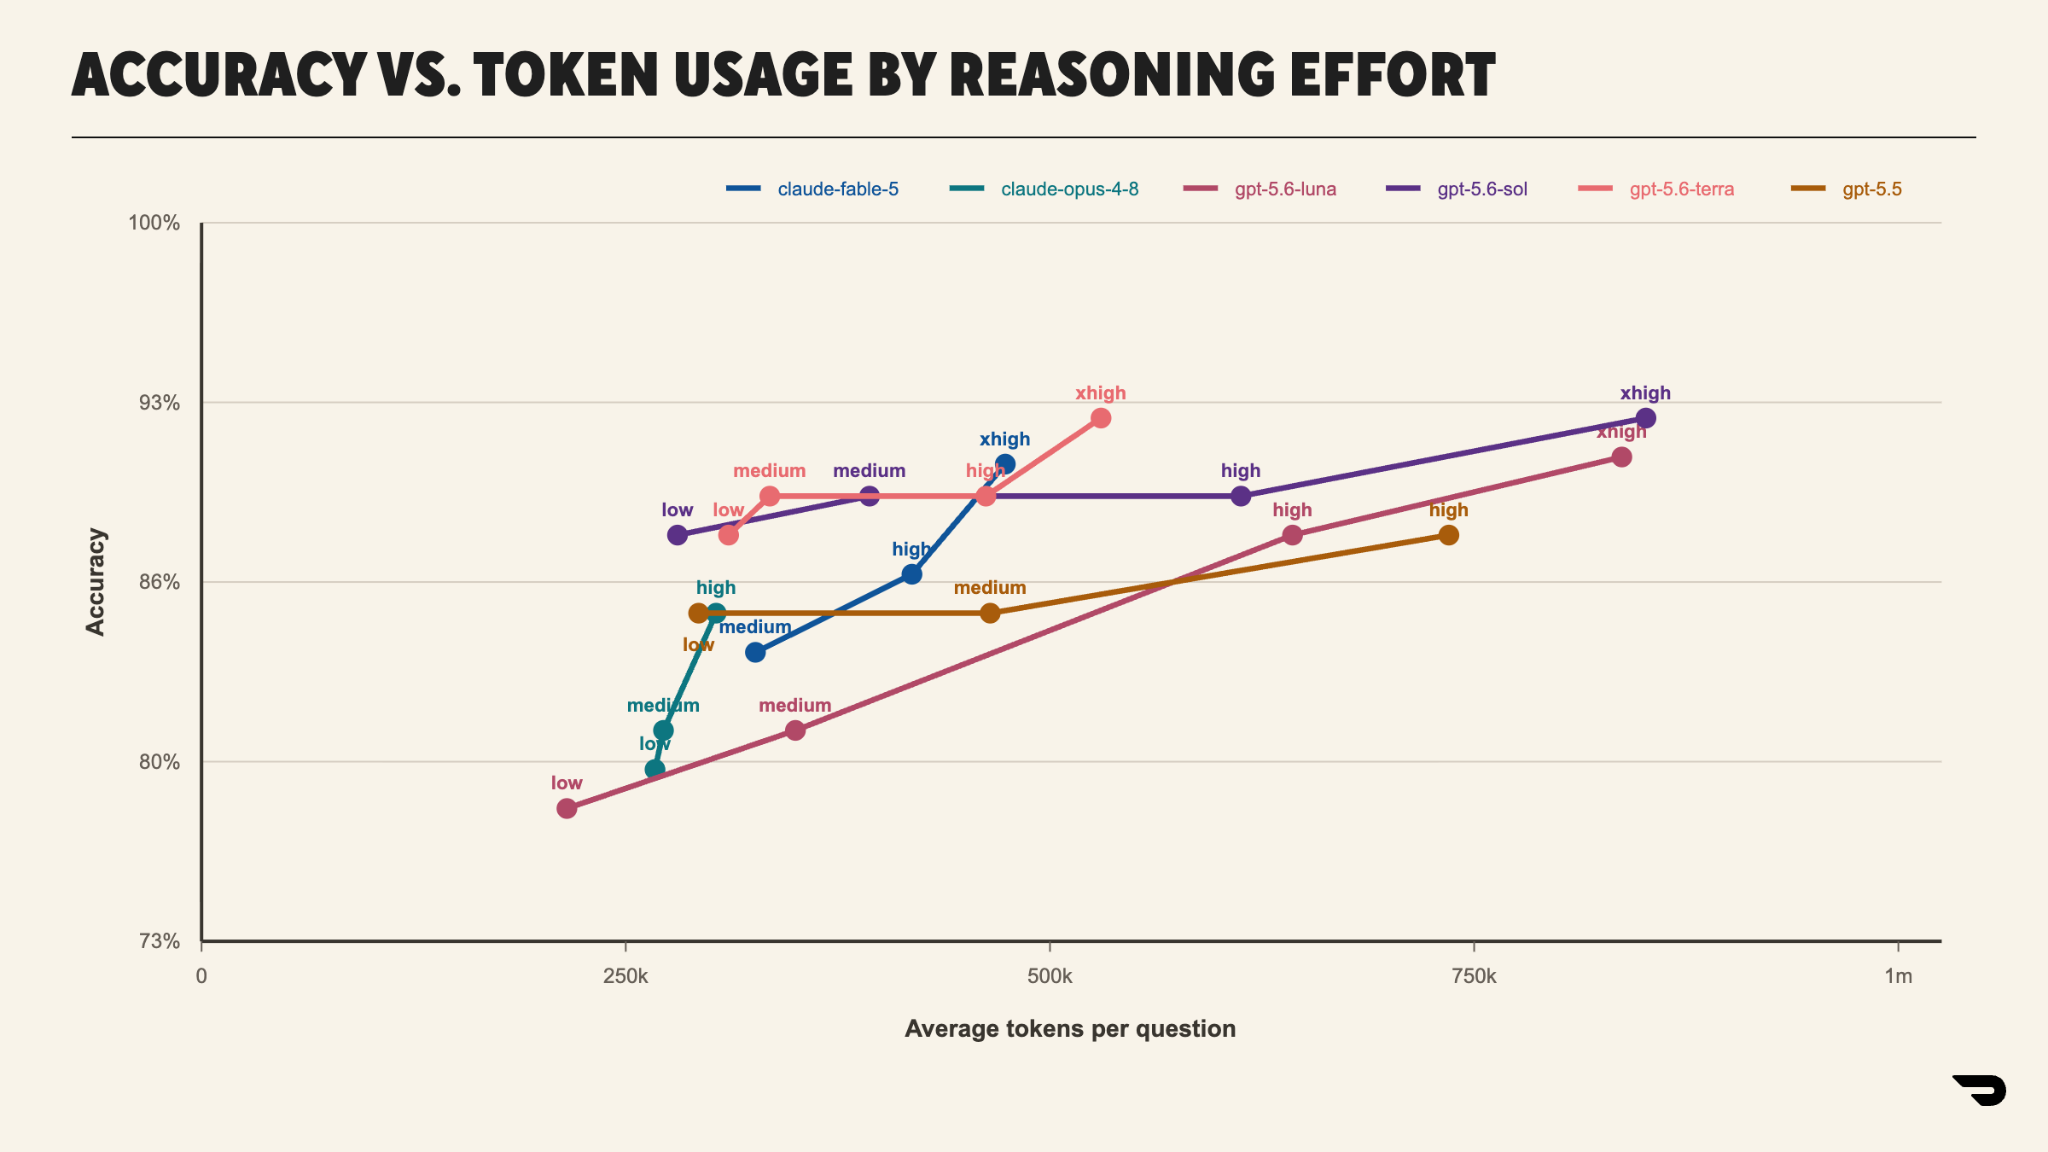
The performance gap at the frontier is small, with both OpenAI and Anthropic models achieving similar scores with extended effort. Naturally, increasing the reasoning budget leads to an increase in latency.
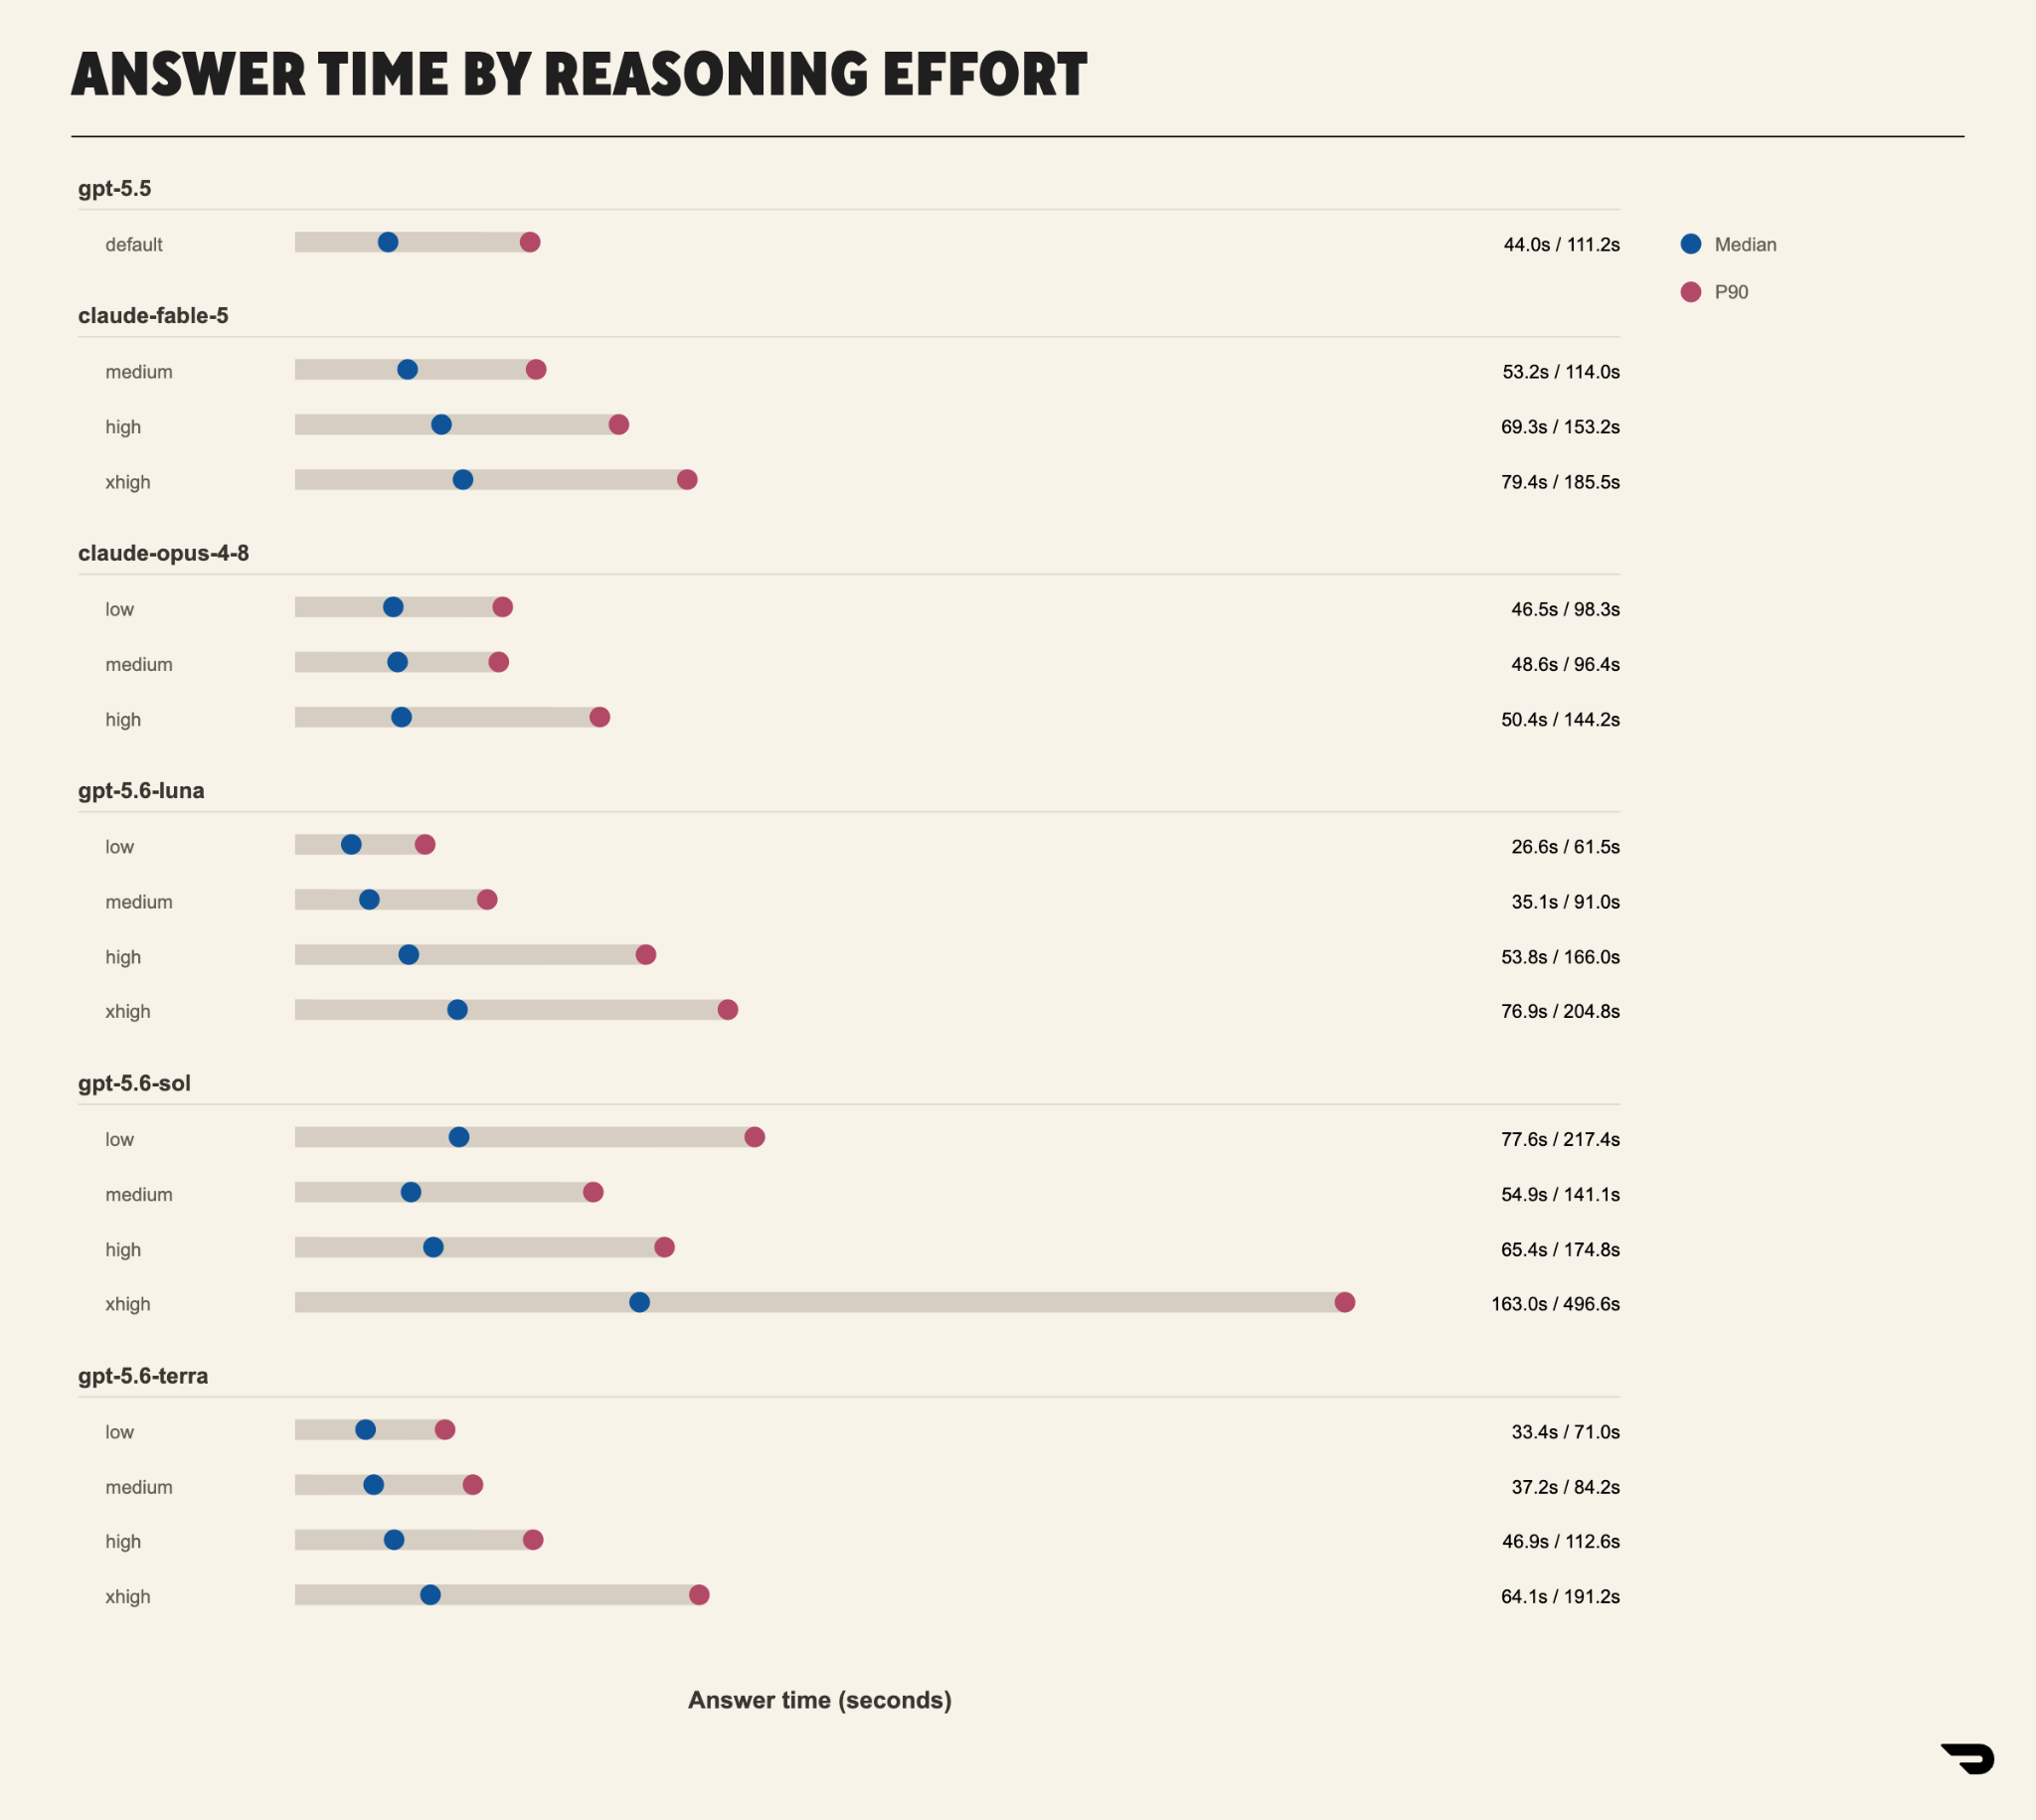
While more reasoning effort monotonically increases the benchmark score, the effect can be deleterious to the system as a whole in the form of longer responses to the user and more frequent tool calls to the data store that increase the likelihood of timeouts and partial results. We observed the following timing distributions across models, as shown in Figure 3:
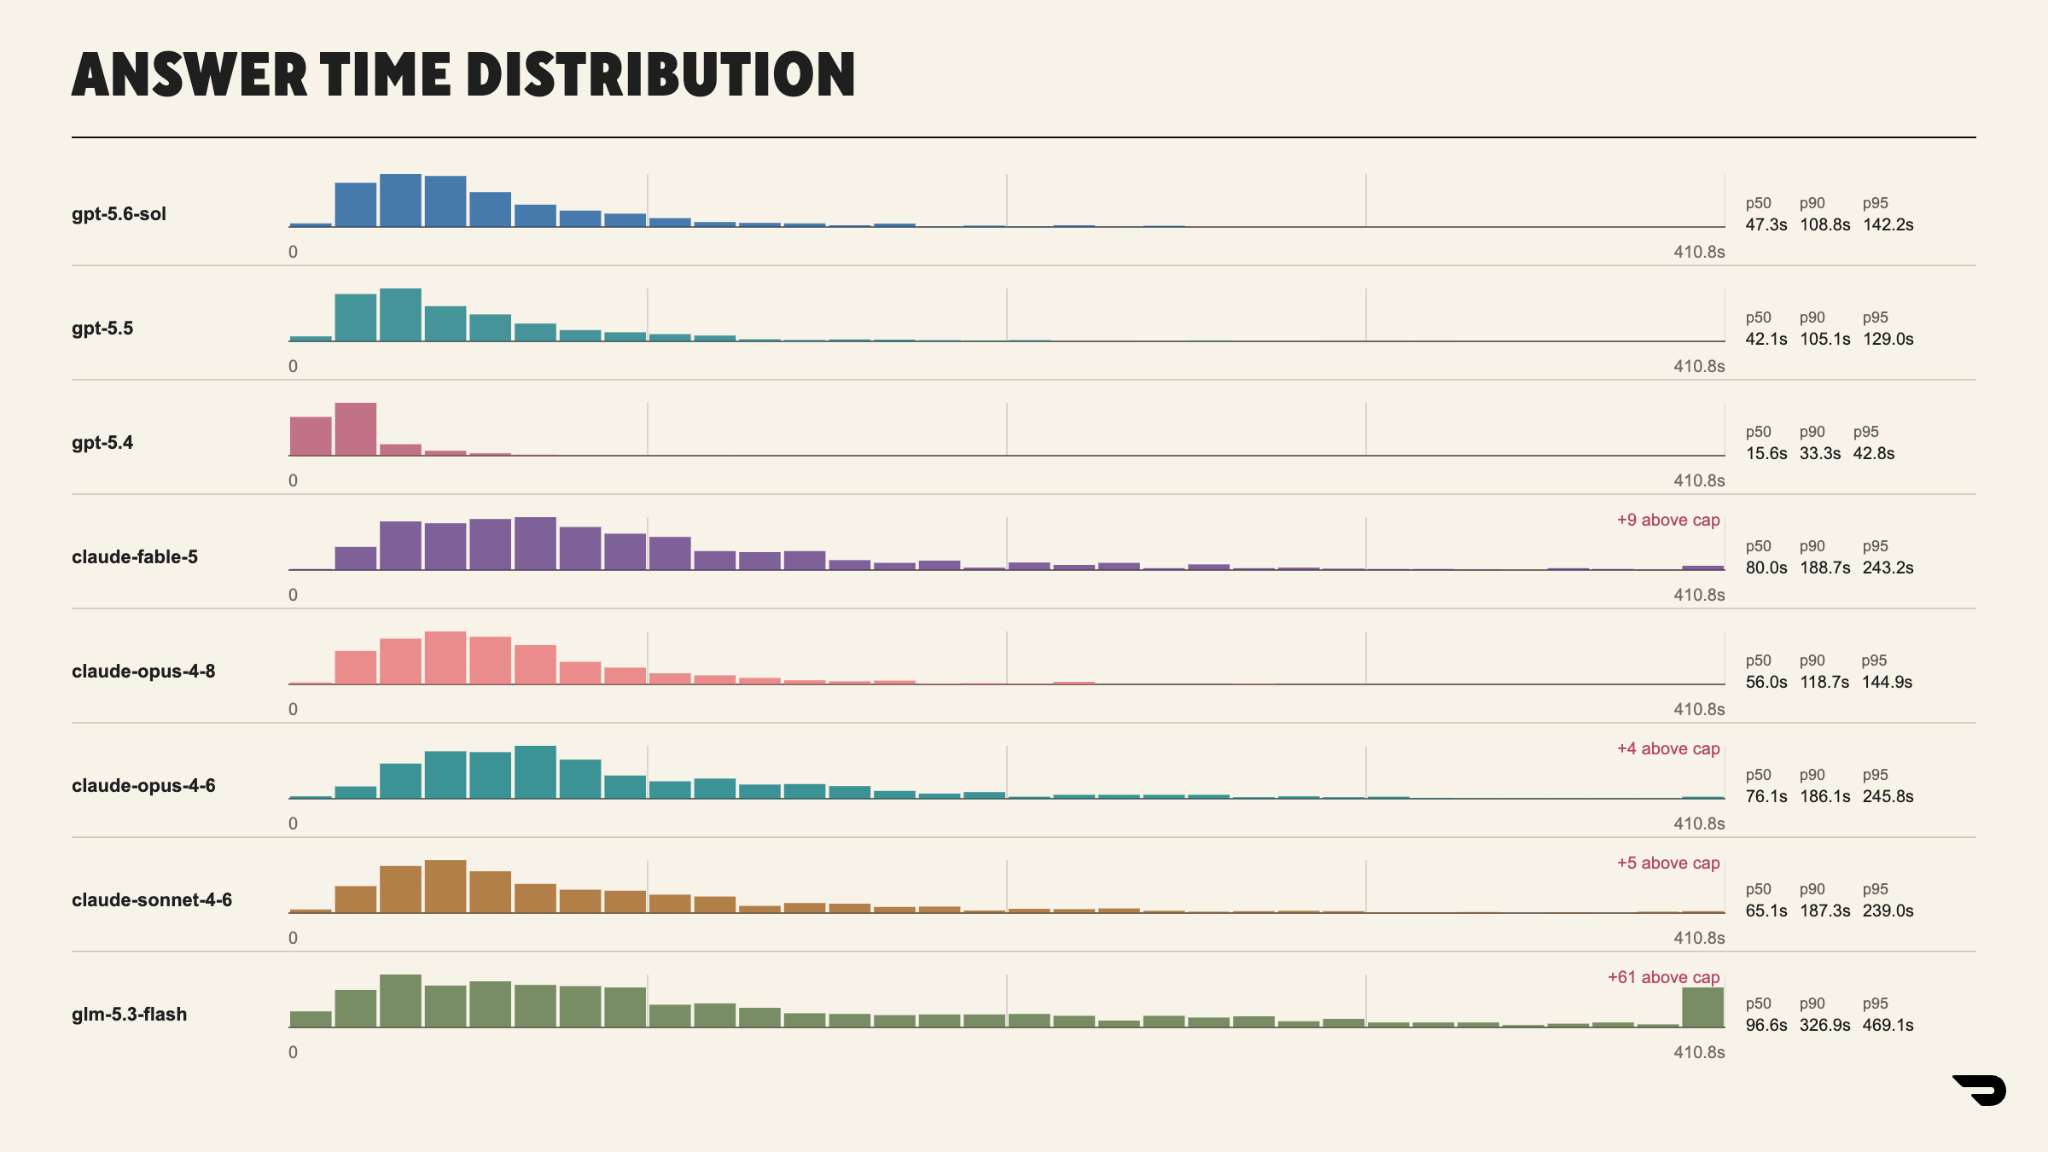
In our harness, the tail latency of the Anthropic models was longer than that of their OpenAI counterparts. We hosted an internal instance of GLM 5.3 Flash via Modal endpoints as a coarse comparison, although its unoptimized nature meant significant timeouts under heavy load.
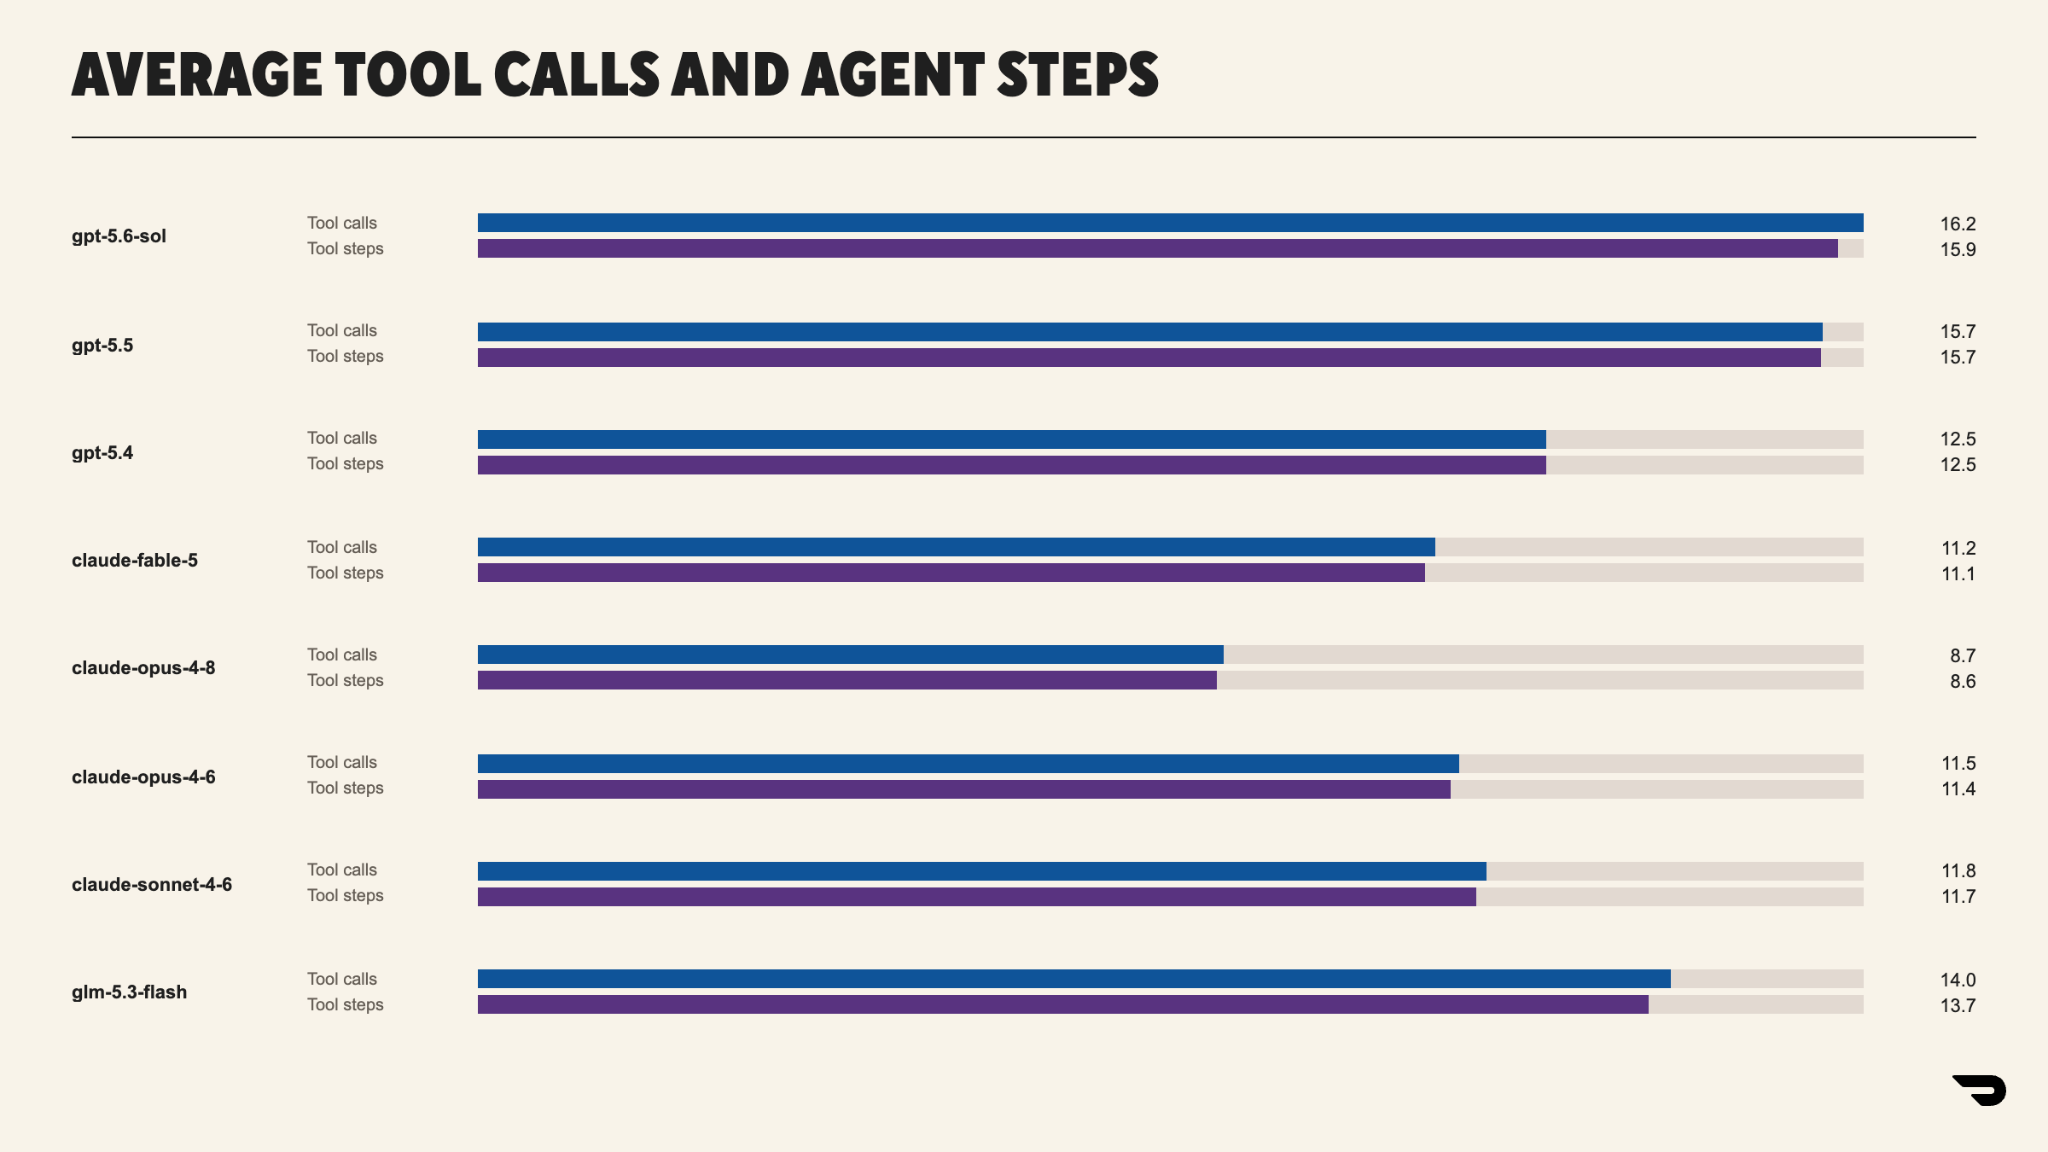
Claude Fable 5 needed fewer tool steps than the GPT models, yet spent longer per step and roughly doubled the runtime. This is evident when comparing the tool trajectories for the various models, as shown in Figure 4:
Although historically we have seen stepwise improvements on benchmark scores for new model variants, the impact of releases has progressively plateaued, as shown in Figure 5:
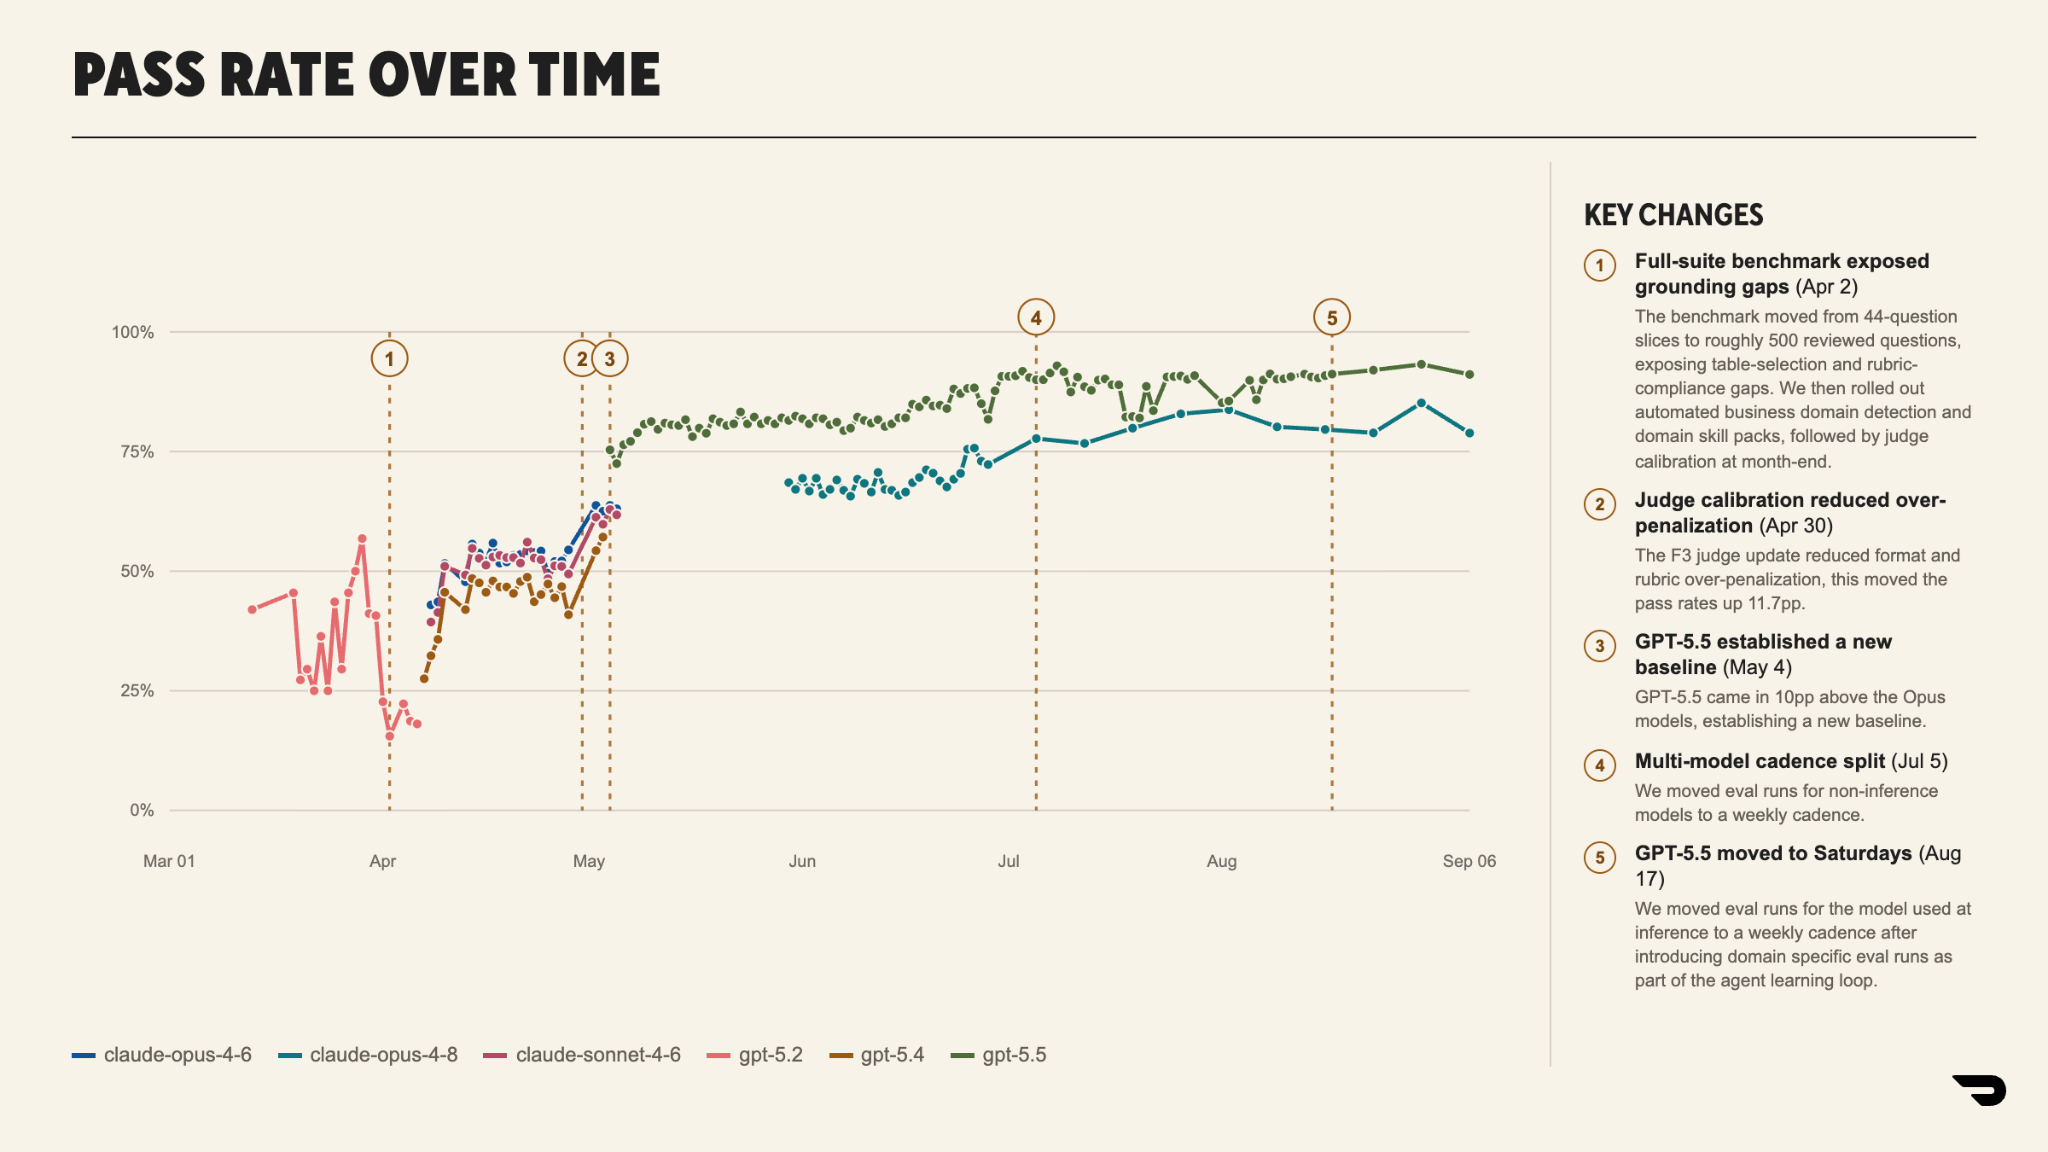
This is a strong indicator that raw model intelligence is no longer the biggest contributing factor to Vera’s improvements, and that the model harness — adding business context, knowledge retrieval, data modeling, SQL validation, and execution — is the dominant vector for improvement going forward.
To validate this hypothesis, we tested both Claude Code and Vera with a common model, Opus 4.8. We gave CC our SQL access tools and the same skills that Vera uses.
We ran 100 representative samples through each system. Vera scored 2.60/3.0, a 73% pass rate, while CC scored 2.16/3.0, a 48% pass rate. This gap fell well outside the estimated noise spread. We found that CC struggled to query modeled tables effectively to draw correct inferences, which emphasized the need for an effective data layer, including a catalog of modeled tables, join pattern heuristics and the like. Coming up: How we build and query that layer.
Retrieval and ranking
More than 10,000 people at DoorDash rely on a data ecosystem that has grown to include more than 200,000 datasets, 350 petabytes of data, and 10 institutional knowledge sources, from code repositories to wikis. With that much data available, the challenge can be knowing what to use and when. The retrieval and ranking step provides those current, accurate, deconflicted data sources.
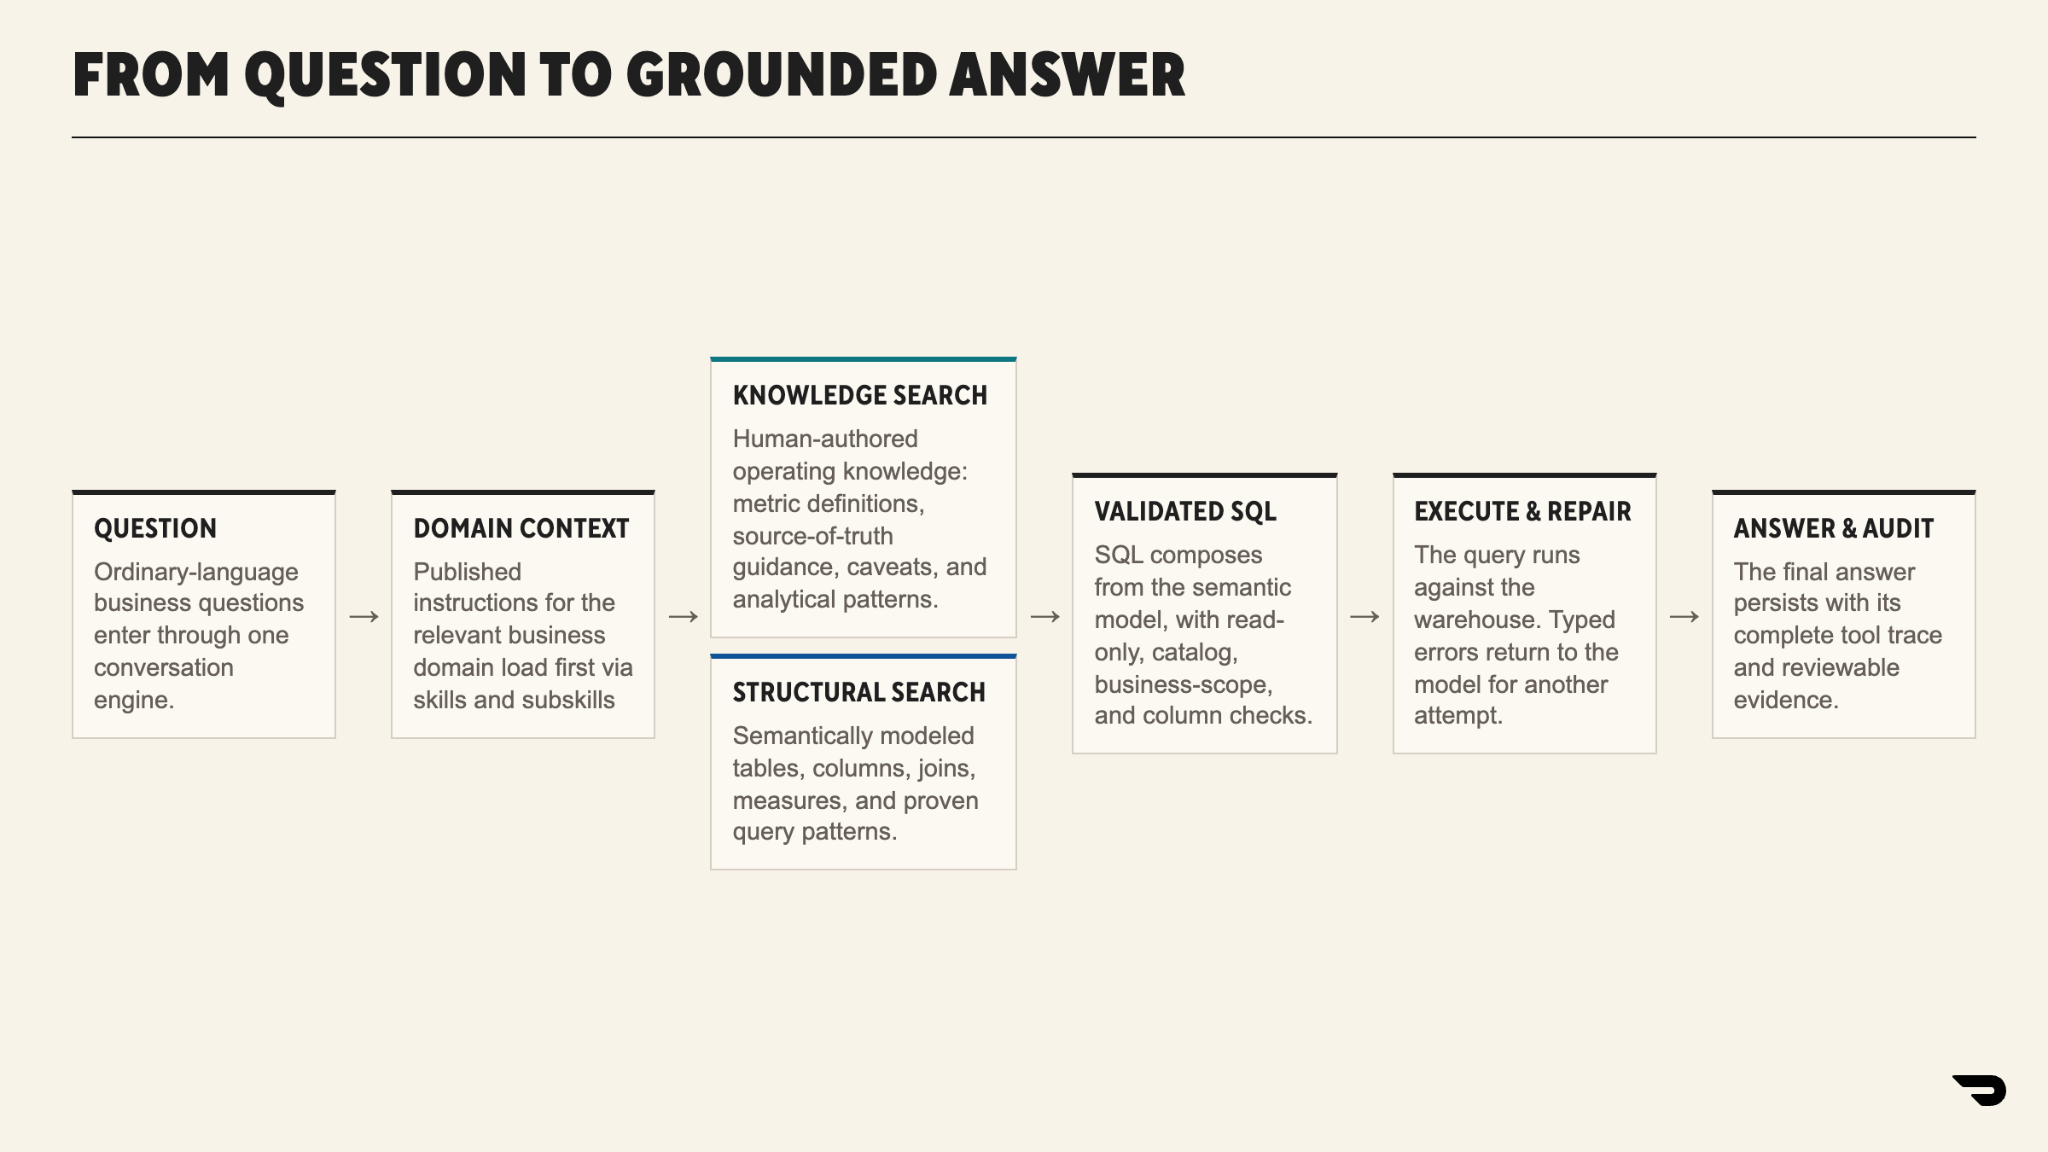
For simplicity, a single embedding model is used across all knowledge stores. Core data tables are indexed offline on a regular cadence, which lets us filter out low-signal queries and strip boilerplate. We learn join patterns and other semantics from the remaining usage patterns, table metadata, code references, and wiki pages to build a rich data model.
The data model constrains runtime behavior; access to unmodeled or unverified sources is blocked at the harness level. One downside is the lag between when data becomes available and when Vera can query it. New tables are discovered and indexed both agentically at inference time and periodically in the background. The accuracy tradeoff is worthwhile because the vast majority of core business tables are long-lived and already indexed.
We also need to consider how to manage the addition of new information. How do we decide when new join patterns or document embeddings are additive for user queries? By default, these sources are marked inactive and are subject to passing an evaluation threshold before a domain owner promotes them. Domain owners can also turn on fully automated promotion for their area.
Additionally, every knowledge source and skill encodes its provenance back to the source material; a change-detection pass regularly polls for source diffs. Material changes result in a change proposal that flows through an approval queue and is subject to the same gating criteria as the evals.
Evals and grading
More than 1,900 evaluations have been contributed by both domain owners and everyday users; a domain owner vets every user contribution before it counts. Each eval is graded by an LLM judge on three questions:
- Did the agent use the right tools?
- Did the approach use the correct tables?
- Was the final answer correct?
We report the weighted aggregate of these answers as the overall score. The judging model was iteratively calibrated at several milestones. The most notable deviation was a tendency to over-penalize correct answers when tables were equivalent but not exact. The recalibrations ensured the judge was robust to numerical imprecisions, accepted equivalent data sources, and ignored minor formatting differences.
The core operational question: How do we source evals across the company that are non-trivial, non-duplicative, and representative of real analytical work without burdening domain owners?
We built tooling into Vera that supplements manual evals by mining everyday work outputs such as Slack threads and Jira tickets. A frontier model reads each work product and drafts a full eval proposal, including the question, a SQL query or rubric, and a complexity rating.
Domain owners then review each proposal and either add it to or drop it from the evaluation set. We have found this to be a better use of expert time than having them write evals from scratch. This has resulted in significantly more evals providing broader coverage, as shown in Figure 7:
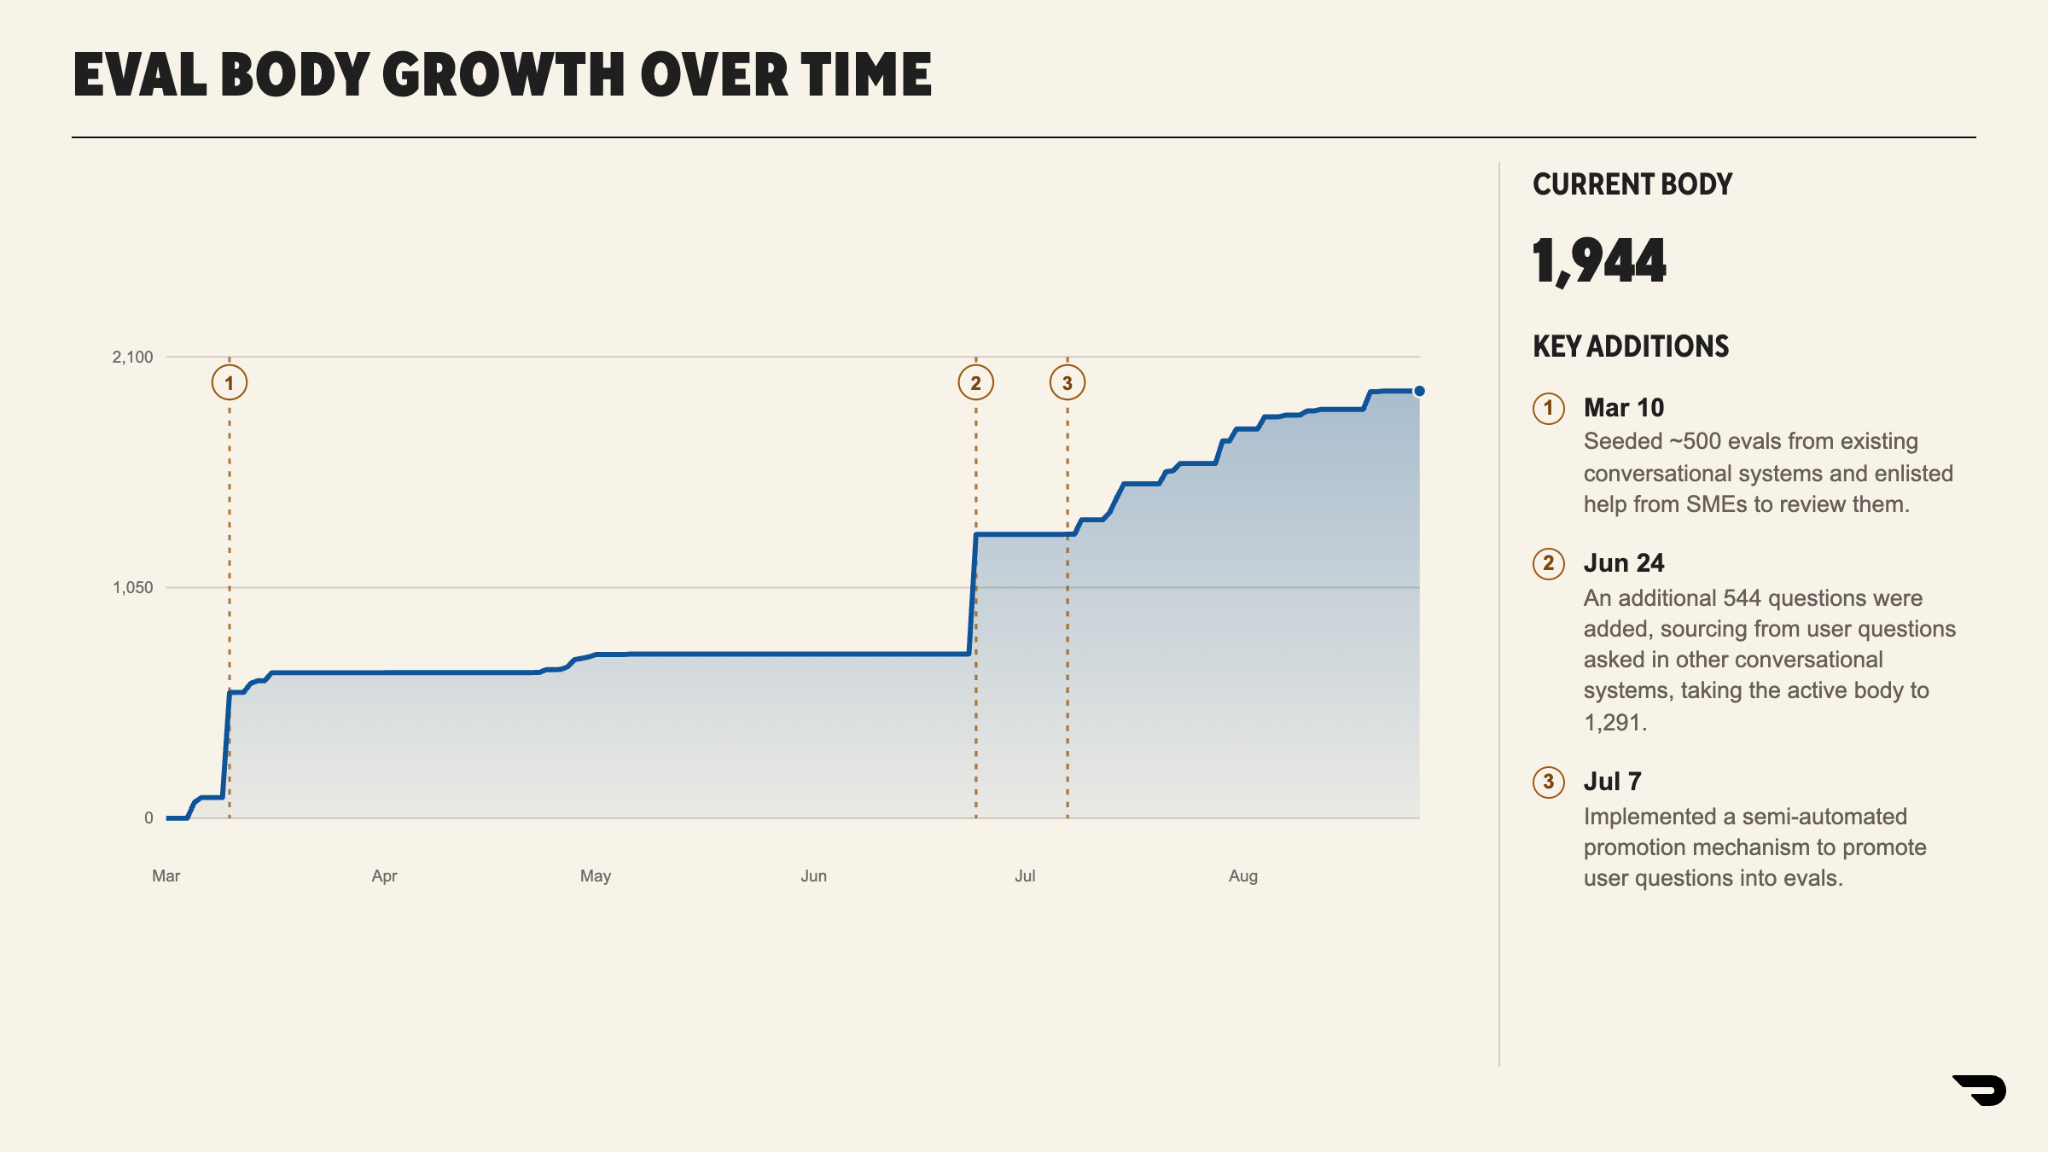
Ensuring quality at this scale becomes more challenging. We automatically deduplicate near-duplicate questions with a similarity measure; domain owners accept 95% of the remaining candidates during review.
Addressing complexity
Although Vera’s focus is answering conversational questions, the world knowledge and post-trained behaviors of the underlying models allow them to address significantly harder questions. We use a coarse taxonomy of problem difficulty:
- Tier 1: Descriptive questions with known definitions and curated patterns, including metric pulls, trends, splits, and sanity checks
- Tier 2: Analyses that could influence business or product decisions, including prioritization, targeting, opportunity sizing, and resource allocation
- Tier 3: Questions requiring deeper interpretation and accountability, including causal analysis, experiment readouts, committed forecasts, and high-stakes decision support
Because the overlap between the tiers is high, it can be challenging to classify queries into discrete buckets, but it is illustrative when considering model effort expenditure for the more complex queries, as shown in Figure 8:
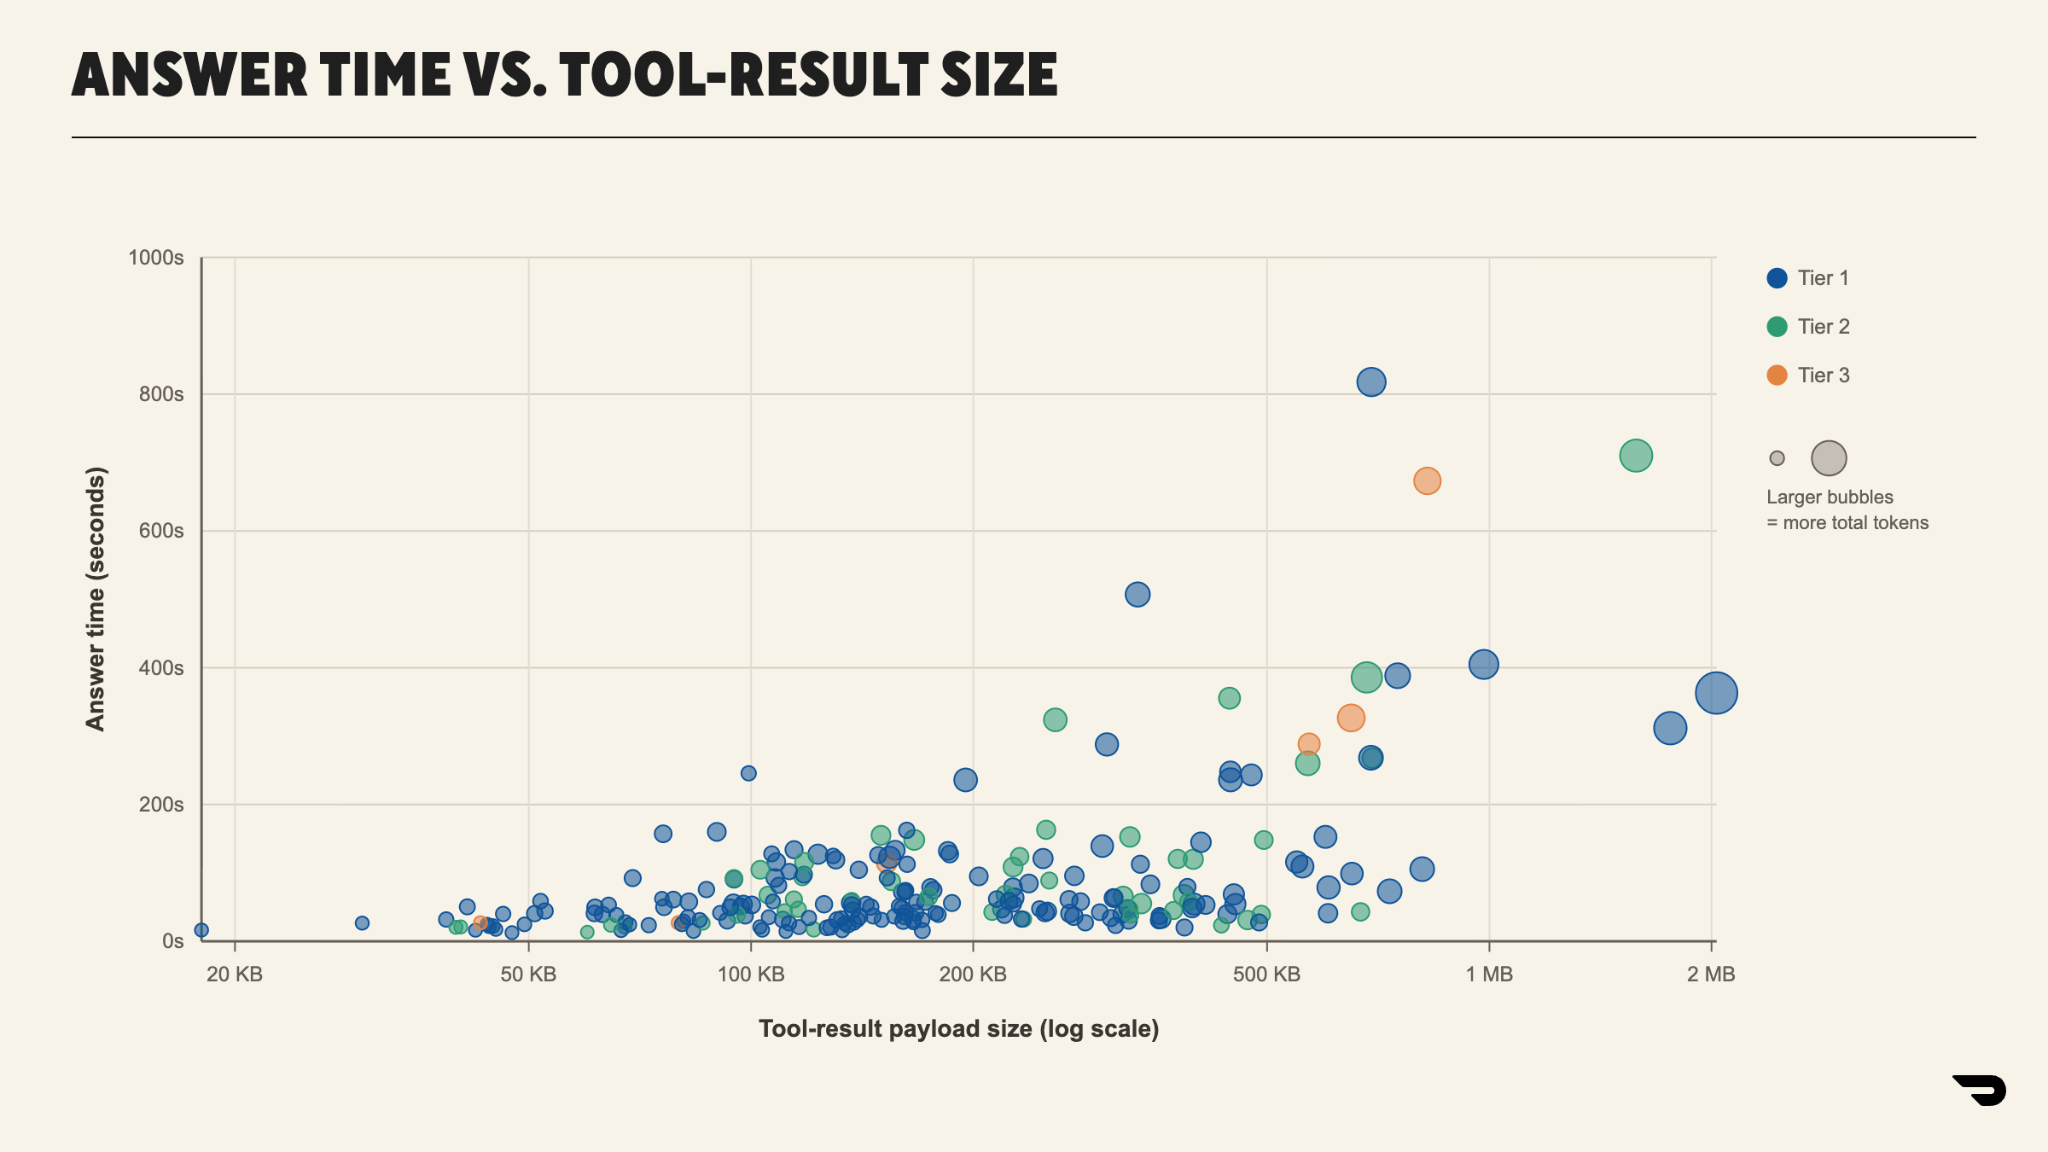
For the more complex queries in Tier 3, we noticed that models tended to stop early and optimistically. There was relevant information to answer the query, but the model often returned superficial — albeit plausible — answers without diving deeper.
For these questions, we built an /analysis flow, which prompted the model to do problem discovery and planning before execution as shown in Figure 9:
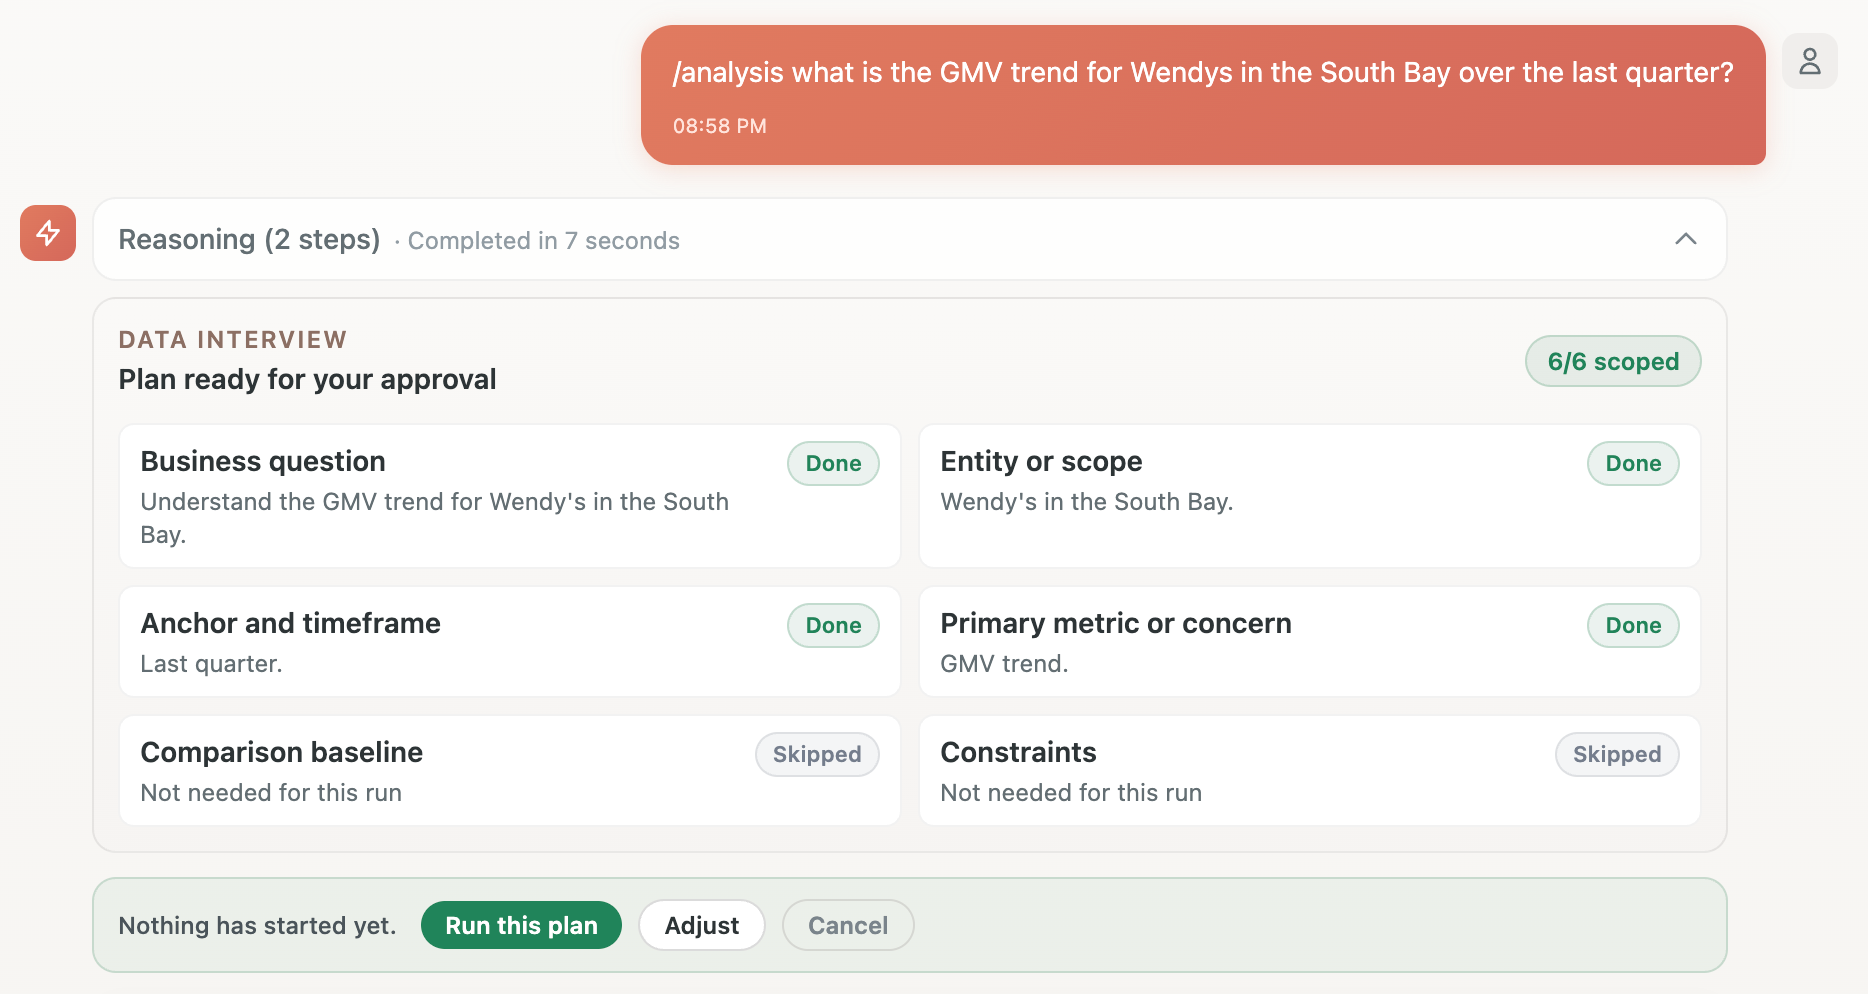
This is where the agent resolves timeframes, desired metrics, relevant scope, and any constraints the user wants to enforce. We’ve found that a structured planning step improves the performance of these Tier 3 evals, but with a large variance -- between 64% and 100% pass rate — across a small sample of 14, showing the need for broader and deeper expert-driven feedback in these areas.
Going forward, we will address as a core focus these harder, more subjective questions in Tier 3.
Takeaways
Over the course of the project, the pass rate moved from 43% to 90% while the evaluation set size doubled twice. Improvements in the intelligence of the underlying models helped drive performance, but it was data engineering around the harness that proved to be most impactful.
There remain multiple open questions:
- How do we continue to maintain quality while reducing cost per answer?
- How do we build evals around more complex data analytics questions and reporting?
- How do faster, better analytics move core business metrics?
As we build data analytics intelligence at DoorDash, we will take up these open questions in later posts in this series.
Contributors: Pavel Astakhov, Andy Fang, Jash Radia, Naveen Srinivasan, Helen Lin, Lokesh Sharma, Adnan Sheikh, Gun Johnson, Harsha Venkat Annapa Reddy