Engineering AI systems people can trust
At DoorDash, our software engineering internship program is designed to be immersive and impactful. Interns don’t just observe — they’re embedded in engineering teams, contributing to projects that Dashers, merchants, consumers, and internal teams use every day.
Across this year’s projects, three interns on three unrelated teams independently converged on the same problem: getting a language model to produce something useful is the easy part. Making that output trustworthy enough to ship is the work.
Their three projects sit at different points on the same spectrum. Gage Garcia’s tool proposes data-quality checks, but by design it can only ever open a draft pull request. Sharif Velasquez’s agent authors production dashboards directly. Shreeyash Gowaikar’s pipeline runs failure investigations on a schedule, with no engineer in the loop until review.
Each step further out on the leash needed its own safeguards: deterministic guardrails that live outside the model, a data representation the model can’t misread, an output schema that constrains what it has to justify, and an evaluation harness that makes “did this help” a number rather than a feeling. That’s the thread running through Part One.
This post is part of a three-part series highlighting work from our summer 2026 interns. Parts 2 and 3 are coming soon.
Trusting an LLM to write data-quality checks
By Gage Garcia
At a glance
Team — Data Mobility
The problem — Data-quality checks are the cheapest defense against silent data corruption, but engineers write them by hand, so most datasets have few or none.
What shipped — A tool that profiles a dataset, uses an LLM to propose checks, and opens a draft pull request adding them to the dataset’s contract.
Impact — One run proposed roughly 12 checks in about 54 seconds. Five engineers across multiple teams ran it on their own data, and their feedback drove six shipped improvements.
At DoorDash, the Data Mobility team builds the infrastructure that powers data ingestion pipelines — the path data takes from the systems that produce it into the tables the rest of the company builds on.
Data-quality checks are the cheapest insurance against silent data corruption. They’re assertions that run in a pipeline after each ingestion, verifying things like “this ID is never null” or “this value stays in range,” and flagging violations before bad data reaches downstream models and dashboards. But engineers write them by hand, so most datasets have few or none — and a missing check fails silently. The bad data lands, models train on it and dashboards report it, and the problem surfaces days later when someone downstream notices a number that can’t be right.
We built a check suggester. It profiles a dataset, uses an LLM to propose checks, and opens a draft pull request that adds them to the dataset’s contract (the versioned file that defines its schema and how it’s ingested), so they run automatically once merged (Figure 1). Generating suggestions was easy. Making them trustworthy enough to ship was the hard part.

Figure 1: The check suggester profiles a dataset, proposes checks, filters them through deterministic rules, and surfaces the survivors for human review before opening a draft pull request.
Why an LLM, not a rules engine
A rules engine could handle the easy cases without a model. A column the profile shows is never null gets a not-null check, and a jointly unique pair gets a unique-key check.
The model earns its place on checks that depend on what the columns mean. On a money-movement table that records one row per payment event from an upstream system, profiling found two tenant ID columns: one written by that system and one by ours. Both were always populated and agreed on every row sampled. The tool proposed flagging any row where the two disagree, and rated it high severity: the IDs come from different systems and should reconcile, so a mismatch is a routing error that could tag production events as test data.
A pairwise comparison would have found that match too, along with dozens of pairs that agree by accident, and it could not tell a rule from a coincidence. The same gap shows up elsewhere. A minimum timestamp of 0001-01-03 is just the smallest value in a column until you recognize it as the date a timestamp defaults to when nothing sets it — which makes it a placeholder written where a null belonged.
Encoding all of that in rules means maintaining lists: the placeholder values worth flagging, the name patterns that mark a cross-system pair, the dates that count as implausible. Someone extends those lists every time a new pattern turns up. The model lets us avoid encoding most of that long tail up front.
Profiling a billion rows without paying for it
The model needs real column statistics, and computing them over a billion rows on every run is too slow to be usable. So the profiler tiers itself: a cheap row count first, then a sampling strategy chosen to match the table’s size, from a full scan on small tables down to a bounded sample on the largest.
That tiering caused the worst bug in the project, and it taught us the most. When the profiler couldn’t compute a column’s statistics, it left the field blank — which was stored the same as a measured zero. The model read “zero non-null values” as “100% null” and proposed a completeness check that would fail on every row. It had reasoned correctly over an input that was wrong.
The fix wasn’t a better prompt. We made those fields optional, holding null for absent rather than a magic number like -1, which would only have moved the ambiguity. The text the model reads now says “not measured” where it used to say “0 non-null values.” A lot of the trust work in an LLM system is in how you represent the data you feed the model, not in the model itself.
Sampling still has limits. A producer hit one on a 1.6-billion-row table, where an allowed-values check was built from a 100,000-row non-random sample that had seen 2 of the column’s 10 values. Stratified sampling is the next step.
Refinement with a human in the loop
We designed for human iteration from the start. The tool presents every suggestion for the engineer to accept or reject. Only accepted checks reach the draft pull request, which then goes through normal review. Each suggestion shows the statistics behind it and, on request, the model’s reasoning, so an engineer can confirm a check against the numbers rather than trust it (Figure 2).
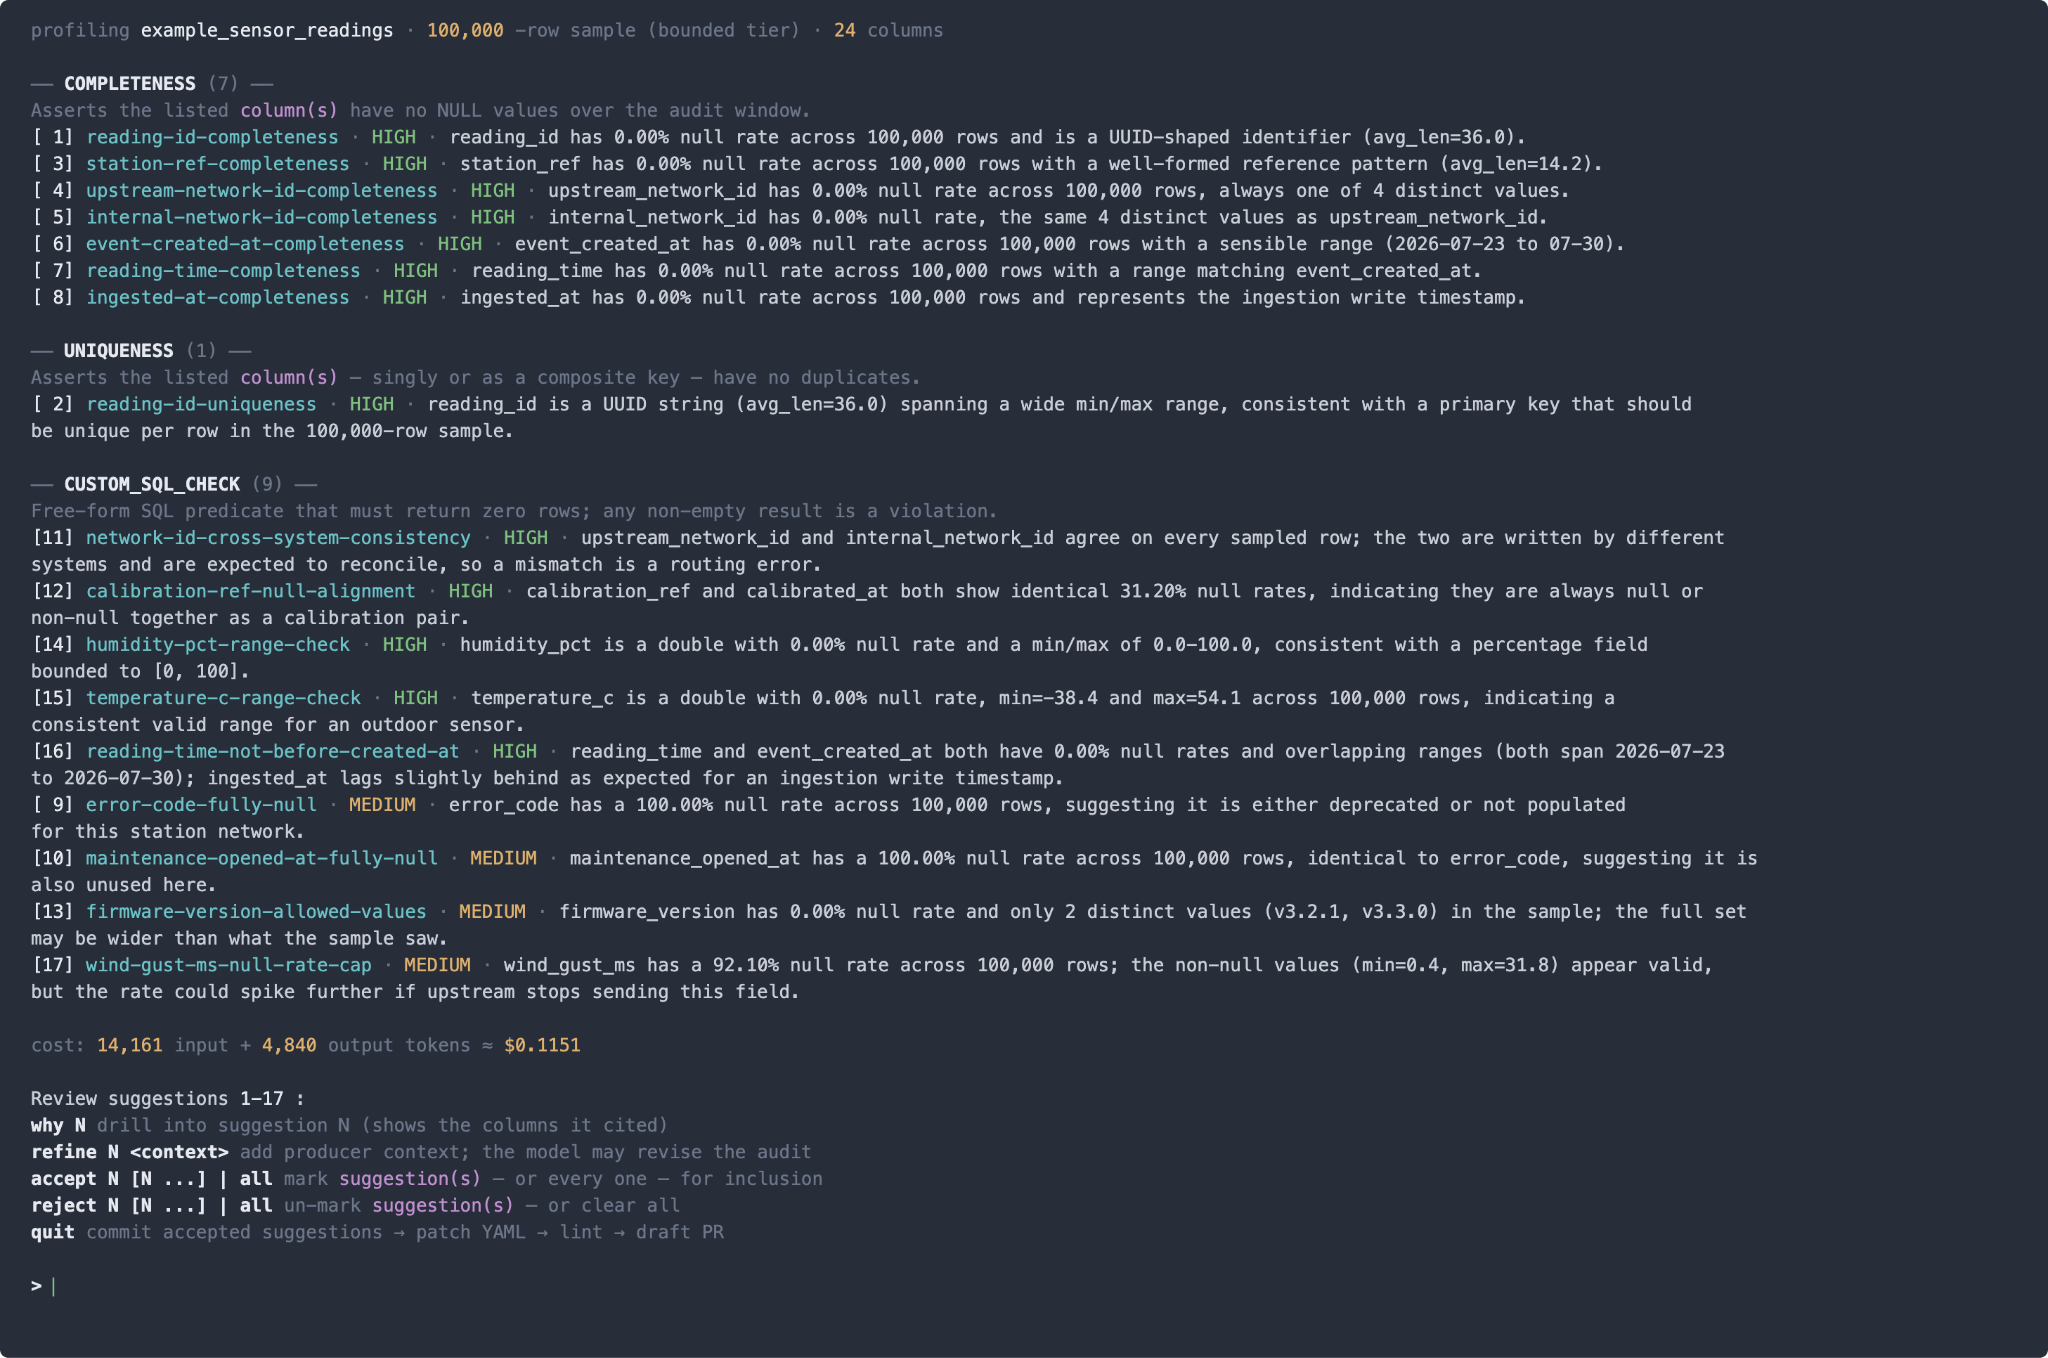
Reviewers also know things the data doesn’t show. A refine command takes that context — “this column is nullable by design” — and the model either revises the check or explains why it stands.
Review only helps if the reviewer notices, so a deterministic pass runs after the model and drops any suggestion that breaks a known rule: a completeness check on a nullable column, or a check that would fire on every row. That last rule has a known false negative, since a genuinely 100% broken column produces the same every-row check and gets dropped too. We accept that trade to kill the far more common false positives. A model won’t apply the same rule the same way on every run, so any rule you depend on has to be enforced in code, outside the model.
When a check fails
A check only earns trust if its failures are visible, so alongside the suggester we built the backend endpoints and UI views that surface each check’s pass/fail history once it’s live. A violation shows up there instead of bad data moving downstream unnoticed, which is the gap we opened with. The main dashboard now has a component detailing all failures for pipelines owned by an engineer’s team, and users can drill down into the execution details of each check (Figure 3).

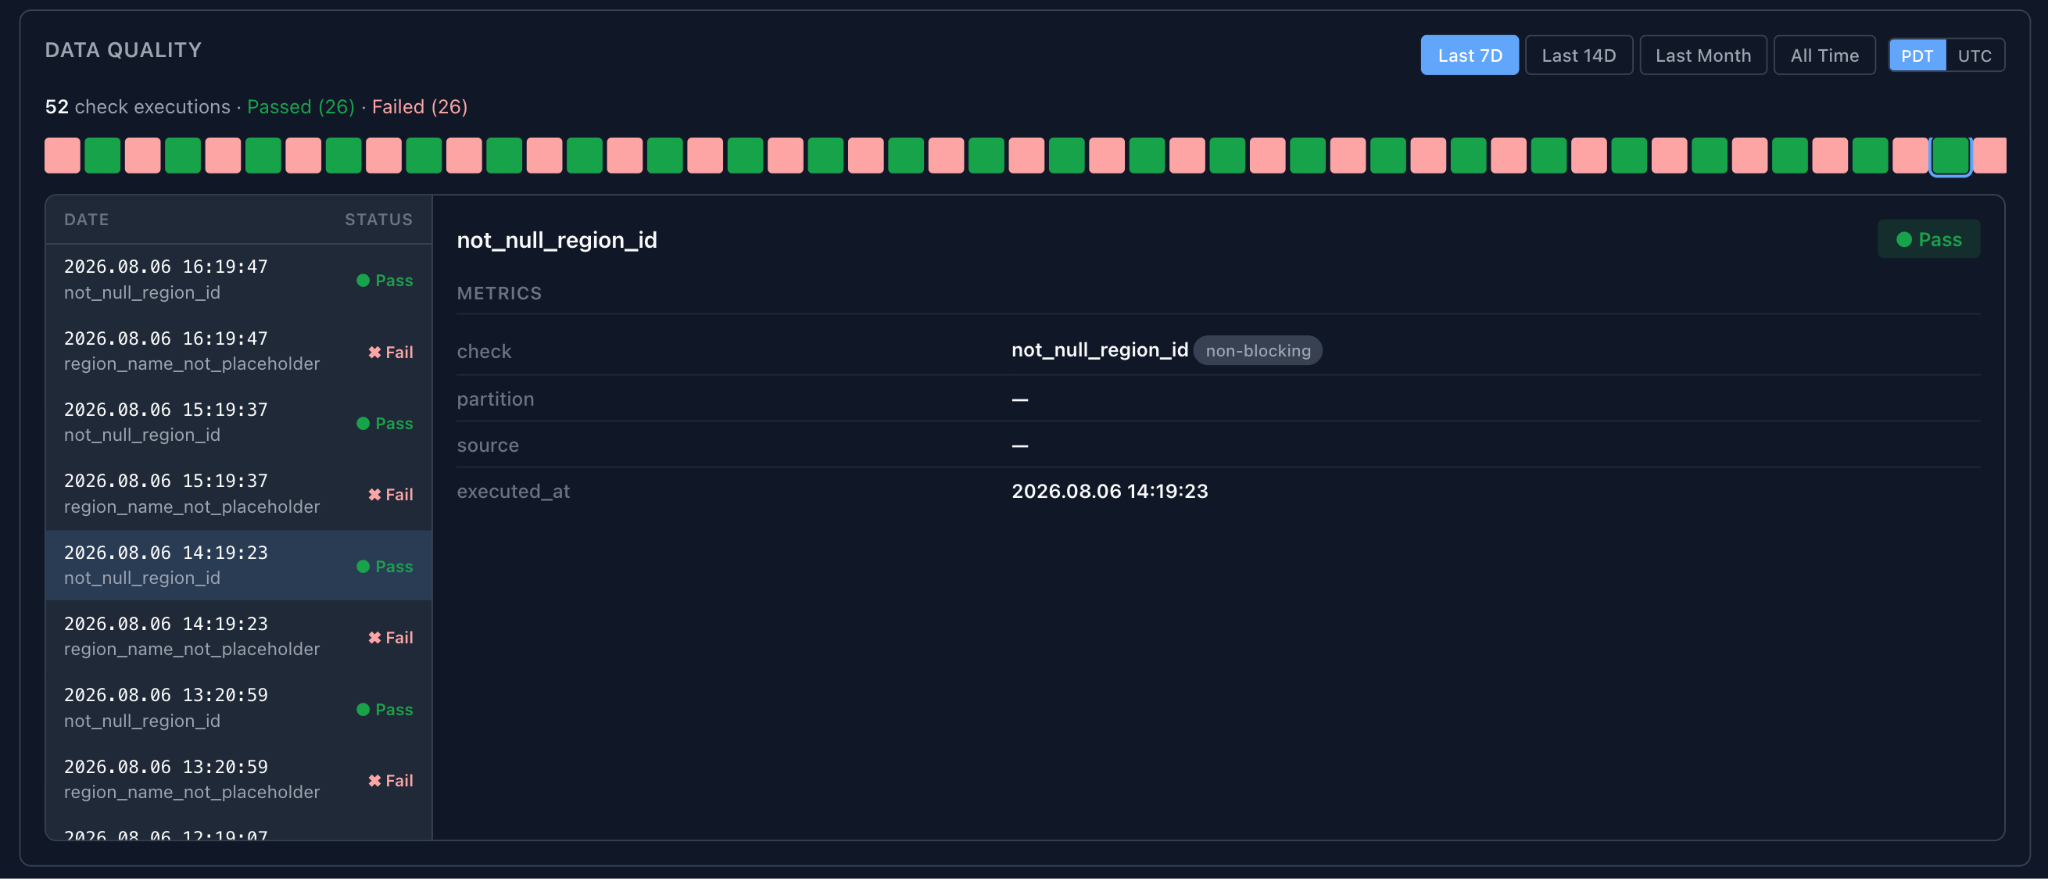
The tool also runs in the other direction. Given a failing check, a diagnose command pulls the rows that violated it together with the dataset’s recent changes and proposes a likely cause, so debugging starts from a hypothesis rather than a blank page. Suggesting a check means reading a profile and proposing a rule; diagnosing a failure means reading a violation and explaining one. Same model, opposite direction, and the same dependency on what you assemble into the prompt.
Driving adoption
The first version only worked after data landed, because it needed a table to profile. That was the top objection we heard: producers write a contract, and the moment they care about its checks is while they’re writing it, not days later. So we added a schema-only mode that proposes checks from the contract alone, before any ingestion has run.
That reframed where the tool belongs. A tool people have to remember to run gets skipped. So we prototyped a bot that runs the suggester automatically on any pull request touching an ingestion contract and posts its checks as inline GitHub suggestions the author can accept with one click.
What we measured, and what’s next
An LLM-as-a-judge evaluation command scores each suggestion on four axes. It asks whether the check is relevant to the column, whether the reasoning holds up, whether the assertion is specific enough to implement, and how likely it is to fire when nothing is wrong.
It found one thing worth acting on. The tool reliably picks the right column and explains why it matters — and then leaves the bound undefined, which showed up in every rejection the judge issued and in some of the suggestions it passed. That points at a schema fix rather than a prompt fix: make the threshold a required output field instead of hoping the model fills it. The evaluation command lets us run the same rubric before and after any prompt or model change and compare the scores, so “did this help” is a number instead of a feeling.
Two other future improvements are within scope. Every check is scoped to one table, so the tool can’t express invariants that span tables, such as cross-dataset consistency or referential integrity. And the evaluation set is small — a few dozen suggestions across a handful of tables — so the scores should be treated as a signal, not a verdict.
Conclusion
Putting an LLM into a workflow that writes code is easy to demo; earning trust takes real engineering. We kept the model behind human review, made its reasoning checkable against the numbers, enforced our rules in code rather than in the prompt, and watched the representation of the data we fed it as closely as the model itself.
We deliberately kept Gage’s tool at arm’s length: it proposes, a human accepts, and the only thing it can write on its own is a draft. Sharif Velasquez’s project moves a step further out — an agent that authors the artifact directly, which meant first rebuilding the artifact into something an agent could reason about at all.
Building a dashboard you can talk to
An AI agent that builds, customizes, and debugs dashboards through conversation.
By Sharif Velasquez
At a glance
Team — ML Platform (MDX)
The problem — ML observability data and its visualizations were scattered across a dozen internal dashboards and third-party tools: hard for engineers to correlate, and effectively unusable for agents.
What shipped — The Smart ML Dashboard: a declarative dashboard format an LLM can author, one data model that every backend maps into, and DoorDash’s ML debugging agent wired directly into the panels.
Models are the cornerstone of DoorDash. Their predictions guide the business: How much time will it take for a given order to be fulfilled? How likely is a user to click on a given ad? How can merchants improve their DoorDash store?
Because of their importance, we want to know as fast as possible when something goes wrong: a feature is defaulting, queries aren’t arriving at the model, or the model’s predictions are far off. That data exists, but it’s scattered across multiple sources, which makes it hard to find where or why a problem occurred, for humans and agents alike.
Data isn’t the only important component. So is how we visualize it, since visualization done right highlights patterns and trends that are nearly impossible to spot in raw data. But visualizations are also scattered across multiple dashboards and third-party services, which further hurts a human’s or an agent’s ability to correlate the root cause of an issue. On top of that, traditional dashboards show the data but usually lack a reasoning layer that explains what’s happening and why.
The tool also had to support customization and granularity. People in different roles — a manager, a machine learning engineer, an engineer from another team — care about different aspects of the data, so it needed to accommodate different business needs, allow easy sharing, and persist for reuse.
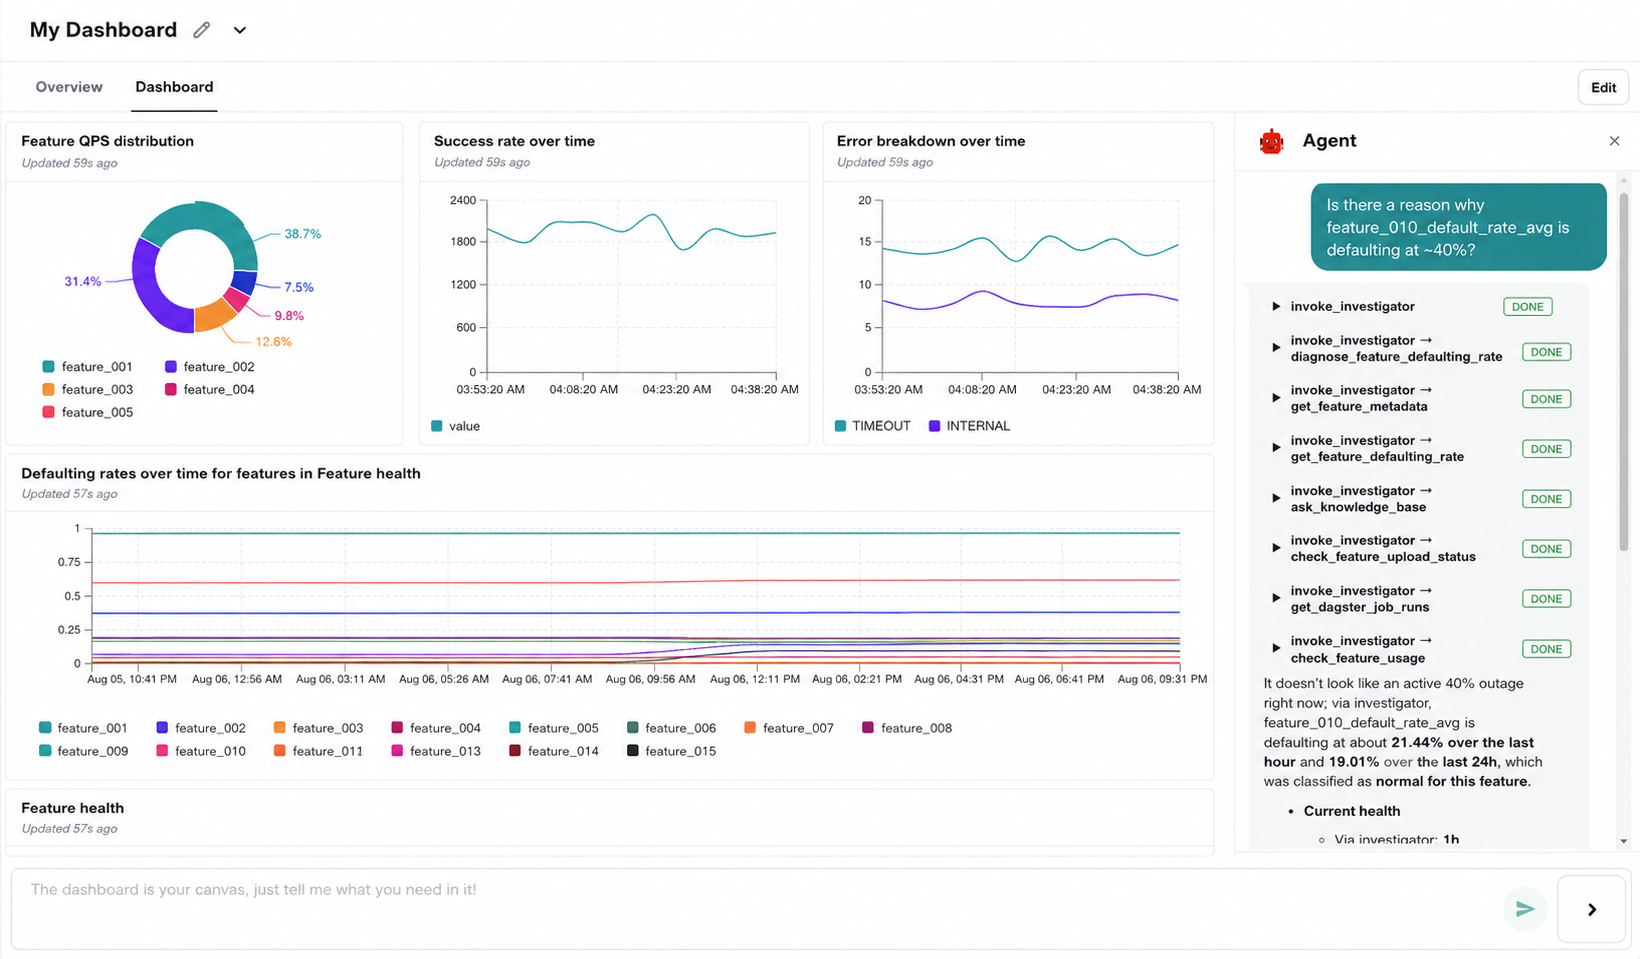
So we built the Smart ML Dashboard: a single place for data retrieval and visualization, with AI-powered dashboard creation and integrated debugging of features, models, and predictors on one surface (Figure 4). It works by modifying the architecture of the MLP agent, our internal ML debugging agent, which has access to a range of tools and knowledge bases across the ML Platform. Getting there took a sequence of design decisions, and two of them made the rest possible: treating dashboards as documents an LLM can write, and mapping every data source into one shape.
Dashboards as documents
The first decision was how to represent the dashboards themselves. How do you teach an LLM to write a dashboard? It can’t see, so it can’t verify that a layout looks right or that a chart follows the user’s intent.
But LLMs are very good at one thing: text. So we stopped treating dashboards as visual elements and started treating them as documents. A dashboard is a YAML file — panels, data queries, transformations, variables, and layout, all declarative. That meant building a parser and a small compiler to turn the YAML description into actual charts.
The YAML flows through a three-phase parser. The first pass checks syntax and reports line and column errors. The second validates shape, with per-issue errors that point at exact paths in the document. The third is a structural walk that catches what a schema can’t, like duplicate panel IDs or references to sources that were never declared. Every failure comes back in a uniform error shape, which means the agent gets the same structured feedback a human editor does, and can iterate on its own output.
The compiler itself is about 15 lines: it walks the parsed tree, dispatches on panel kind, and returns a React element. No hooks, no plugin lookups, no data fetching — all of that happens at render time instead. Keeping the compiler pure makes it trivially testable and, more importantly, makes the YAML-to-UI mapping a mechanical translation the LLM can reason about without modeling React’s execution model.
One data shape for every source
The second major design decision was the shape of the data the dashboard processes. Taking inspiration from the data model of a widely used observability platform, we decided to present all data in one shape: the DataFrame — a list of named, typed fields, plus row-count metadata and per-field labels and config. A source plugin is then just an async function that returns DataFrames.
This one abstraction buys three properties:
- Panels don’t care where their data came from. A timeseries panel renders any DataFrame with a time field and one or more number fields. Same panel, any backend.
- Transformations compose universally. Each is a pure function from frames to frames. They run in order after the fetch, and none of them know or care which source produced the frames.
- The LLM only has to learn one data model.
Teaching the agent to write dashaml
With that foundation in place and the problem reduced to text generation, the third decision was how to write prompts that would teach the agent to understand and write dashaml, the language used to define dashboards. This proved harder than it first appeared. Beyond learning panel structures, the LLM also had to reason about data transformations. For example, if a panel required a feature’s defaulting rate but the data source provided a time series, the model had to infer that it should extract the latest value rather than display the whole series.
The challenge grew with the sheer number of panel configurations: field options, units, thresholds, mappings, and more. Encoding all of it for every panel would quickly exhaust the context window. After many iterations, we adopted an “ask only for what you need” approach: the agent initially receives only concise descriptions of panels and data sources, and can request more detail through tool calls when necessary. This reduced context usage and improved the agent’s ability to generate and debug dashboards.
This is enabled by the runtime’s registry design. Panels, sources, transformations, and cells each live in a registry populated by side-effectful imports, and each entry carries both a machine-readable schema, for validation and codegen, and human-readable documentation, for the agent. Adding a new panel is a single file that registers itself — and the agent gains the ability to use it the moment the module is imported. No prompt changes, no retraining.
The result is that the agent’s ability to write correct, useful dashboards scaled with the platform instead of degrading as we added features.
Debugging where the data already is
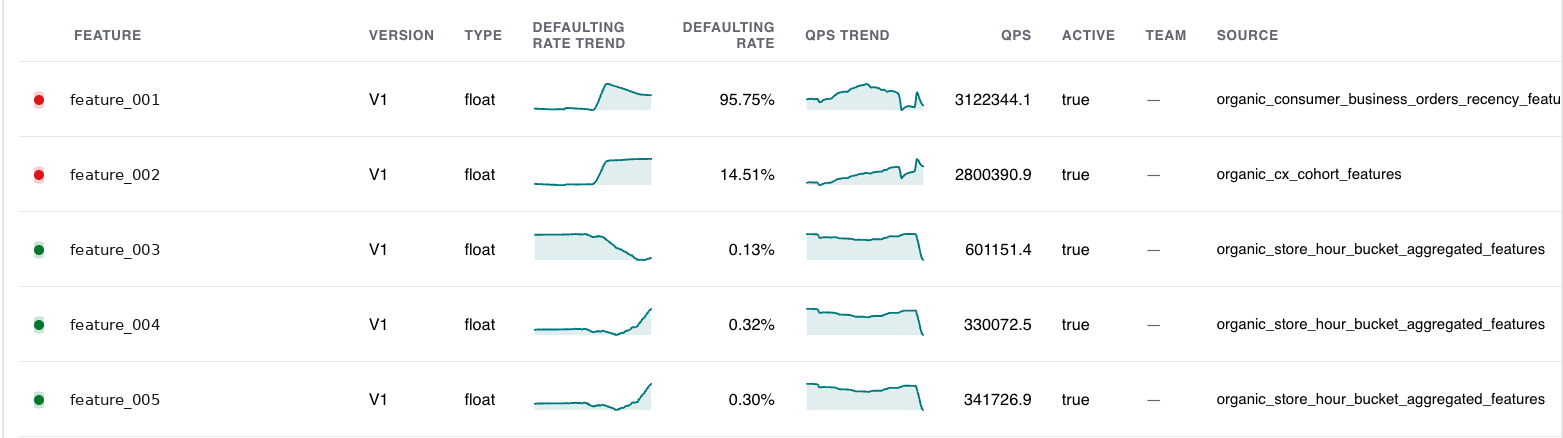
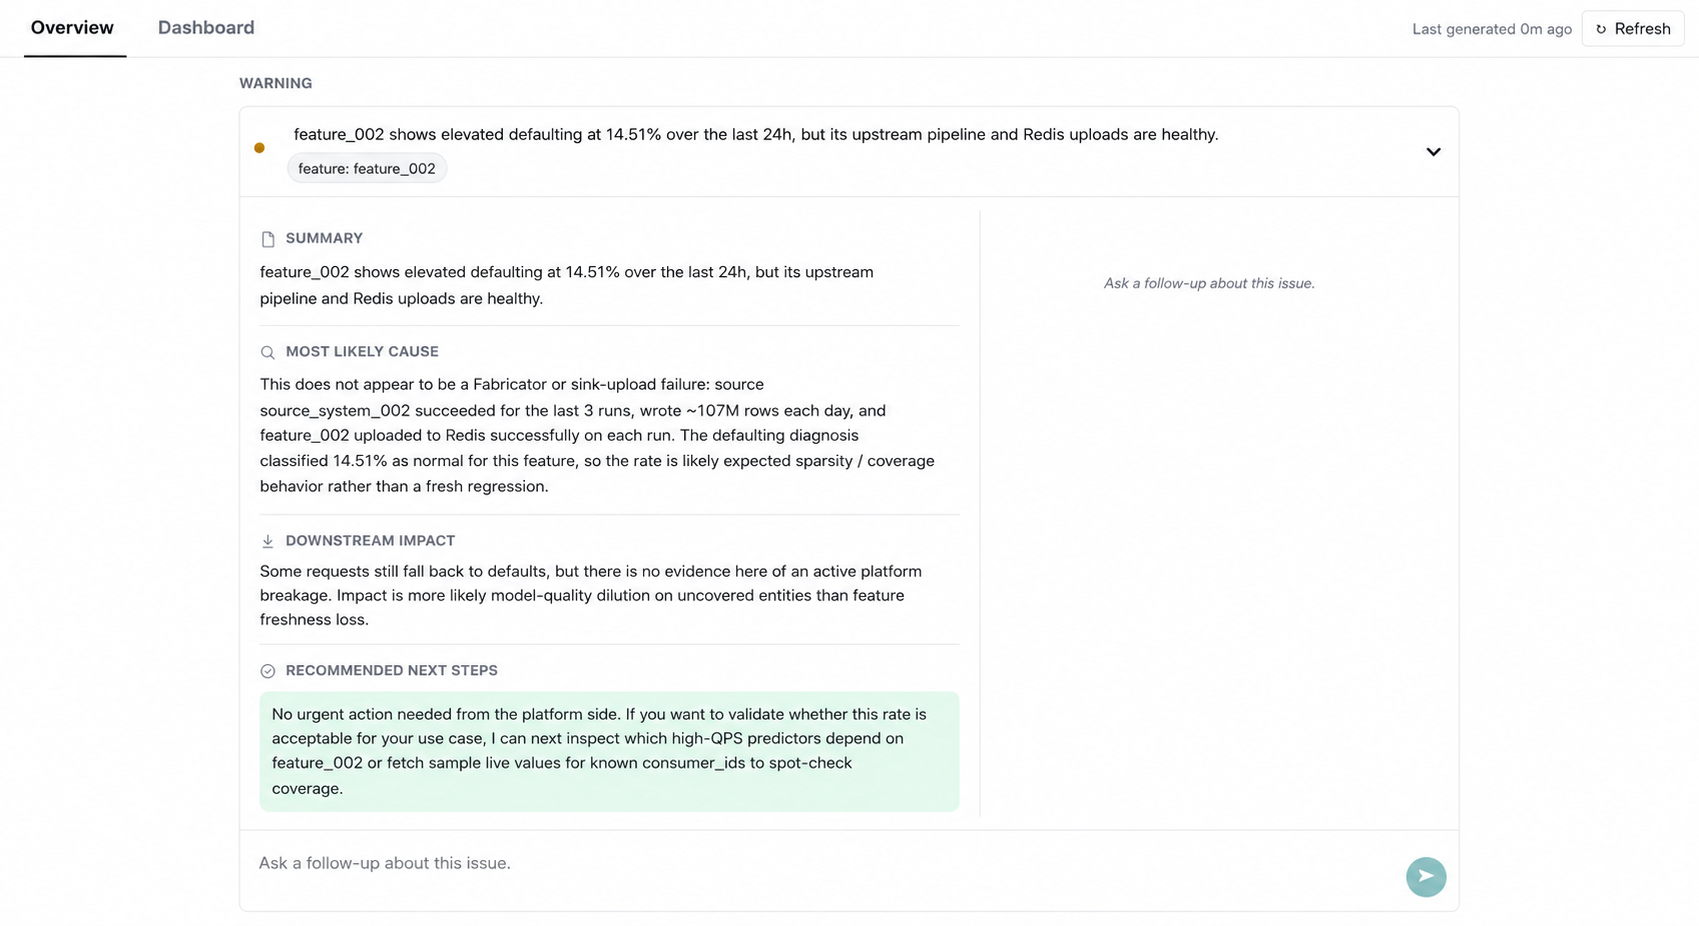
The fourth decision was to build debugging into the panels themselves. Because everything now lives in the same place, correlating a feature’s defaulting rate with, say, an upstream job that failed three hours ago becomes trivial for an agent (Figures 5 and 6). It also means multiple problems can be held in separate conversations at once, so debugging parallelizes.
What the user cares about is itself a signal
A dashboard isn’t only useful for visualizing data — it’s also a declaration of what the user cares about. That’s valuable information, because it tells us which things are relevant and lets us prepare an agentic report on them before the user even asks.
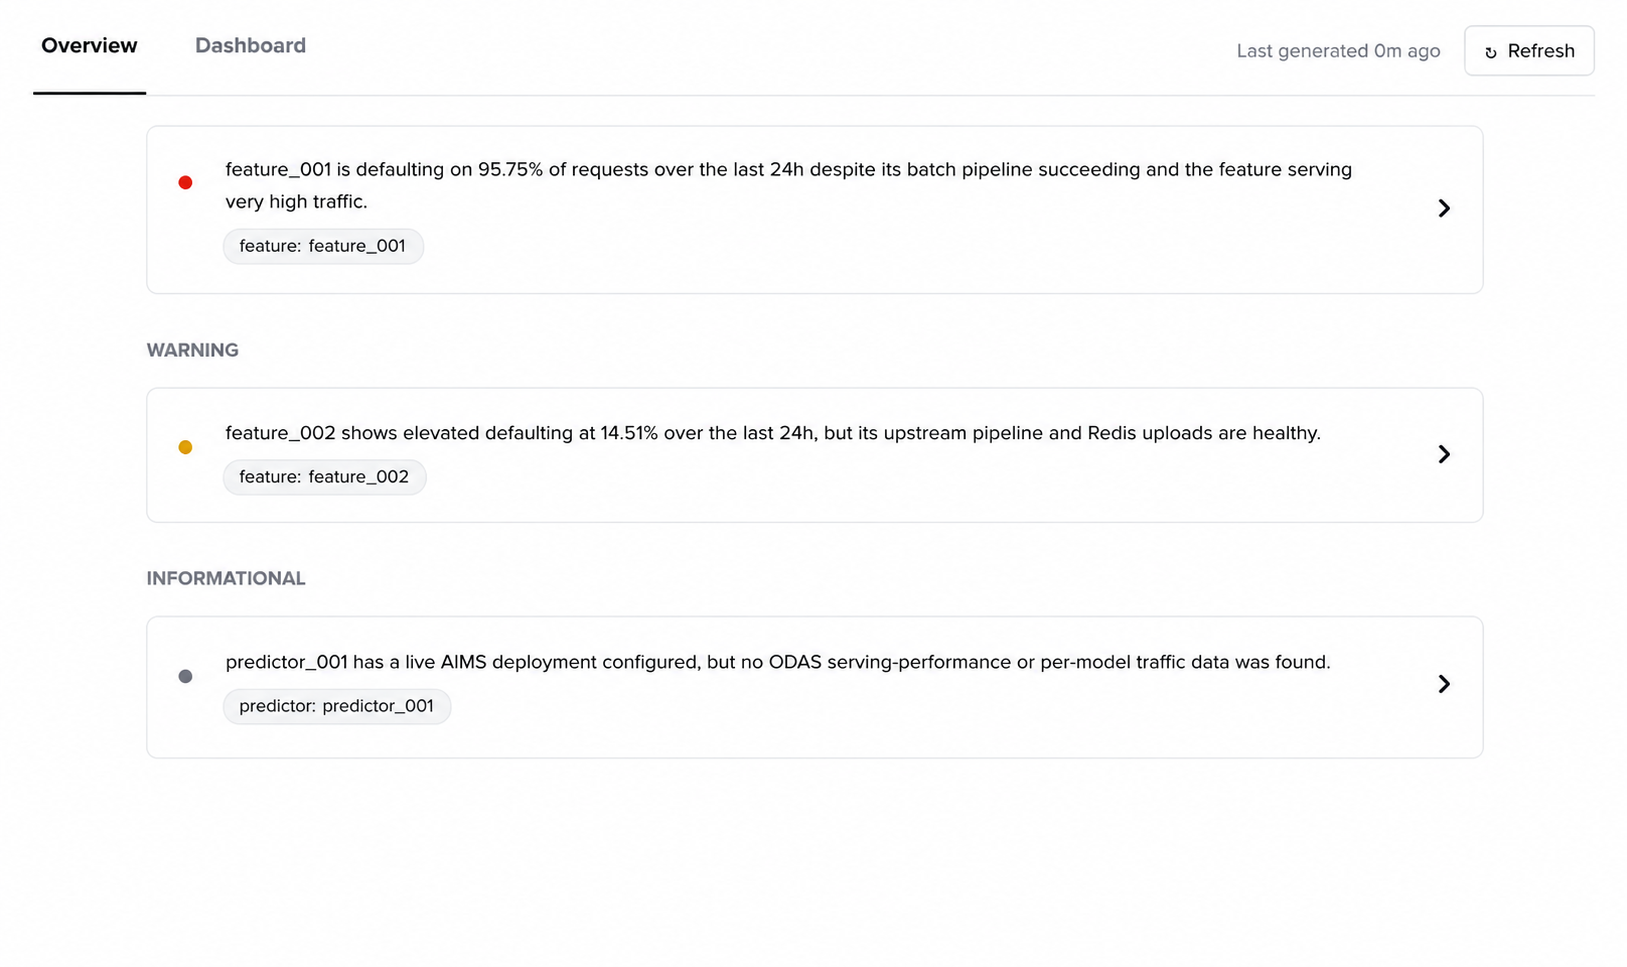
That also helps with scale. With a few items, spotting problems by looking at a dashboard is easy. With hundreds, it becomes increasingly difficult. So we created an Overview tab that gives you the agent’s analysis without requiring you to read the data in the dashboard at all (Figures 7 and 8).
Conclusion
The Smart ML Dashboard started from a simple observation: our observability and debugging signals were scattered, which made the process worse for both humans and agents. Bringing those signals onto one surface, in a format an agent can both write and read, changed how debugging works: correlating a defaulting feature with a failed upstream job becomes one conversation instead of a search across dashboards, and several issues can be investigated in parallel. Because a dashboard also declares what its owner cares about, the agent can start investigating those signals before anyone asks.
Acknowledgments
Thank you very much to my mentor Bowen Dan for her incredible guidance, and to the entire MDX team for their invaluable support.
Sharif’s agent writes the artifact, and a person reads the result. Shreeyash Gowaikar’s project takes the last step. An investigation starts on a schedule, gathers its own evidence, and reaches a conclusion before any engineer looks at it. The project also makes an honest attempt to find out whether building all that structure was worth it.
Closing the loop: automated root cause analysis for production agents
By Shreeyash Gowaikar
At a glance
Team — Dasher & Logistics (Machine Learning Engineering)
The problem — Detecting that a multi-agent system has failed is largely solved. Explaining why still means an engineer reading transcripts, so review coverage shrinks as usage grows.
What shipped — A cron-triggered, hypothesis-driven root cause pipeline — a planner that hypothesizes, workers that gather evidence, a manager that adjudicates — plus a four-condition benchmark against off-the-shelf agent harnesses over two weeks of production traffic.
Impact — Diagnosis moves from on-demand and manual to continuous, with no engineer in the loop until review. Every finding is traceable to its source session, causal chain, and a named fix location. The pipeline costs 0.67x the general-purpose agent baseline per transcript audited, about a 33% saving.
A user-facing multi-agent system fails in ways that cannot be exhaustively enumerated before launch. Unlike a deterministic service, a multi-agent system has open-ended input, stochastic execution, and unpredictable user behavior, so its failure surface is not a finite list. It widens as the system’s scope and autonomy evolve.
That becomes a problem worth solving quickly at DoorDash, where we are building agentic capability for consumers, Dashers, and merchants alike. Detecting failures in these systems is by now largely solved: per-axis judges and trend monitoring reliably indicate that something has degraded. Diagnosing them has not reached the same maturity. That step is still an engineer reading a transcript, forming a hypothesis, and confirming it against logs and recent commits — increasingly with the help of an agentic tool. Even for a single assistant in a limited pilot, reviewing everything the judges flag is already more work than a team can absorb, so coverage is partial by construction and shrinks as usage scales.
We automated that step to close the feedback loop from monitoring, and then measured whether building a bespoke pipeline for it was justified at all. The short answer: off-the-shelf agent harnesses can already root-cause real failures, and a structured pipeline adds findings that are traceable to a session, a causal chain, and a named fix location, at 0.67x the cost per transcript audited of a general-purpose agent.
Why diagnosis is the bottleneck
A rough sizing makes the constraint concrete. One of our assistants, in a limited pilot, produces thousands of conversation transcripts per week. Even a 2% flag rate would still mean a steady stream of conversations requiring review each week, creating a substantial manual review burden before accounting for deeper investigation and fixes.
Delegating each investigation to a general-purpose coding agent reduces the per-session time considerably, and engineers already do this. But it doesn’t remove the bottleneck, because someone must still select which sessions to investigate, decide which evidence to expose, and judge whether the returned answer is trustworthy enough to act on. Those decisions are rarely documented anywhere. Meanwhile the unreviewed remainder is where trust quietly erodes, and the imbalance worsens as volume grows, because review cost scales with usage and the team does not.
Three properties of a production multi-agent system make each investigation expensive:
- Fault origin is decoupled from fault symptoms. A failure surfacing in the final turn can originate several agents upstream, so reading the trace alone does not localize it.
- Production guardrails are dense. These assistants operate in a policy-heavy, regulated domain. Its decisions cover what can be promised, what must be escalated, and how each market handles each edge case. That policy is enforced across system prompts, policy engines, and tool-layer checks, and the surface is large enough that two rules can silently conflict. When the agent does the wrong thing, it’s hard to tell whether a rule was missing, wrong, overridden, or simply not followed. In a synthetic red-team scenario, a single adversarial line in a system prompt of several hundred benign ones was enough to change the agent’s behavior.
- Failure modes are heterogeneous, and many are not semantic. A trace can fail through an execution fault — truncation, premature termination, an orphaned tool call — or through contradictory context, a malformed handoff, or sampling variance. These share almost nothing diagnostically, and stochastic execution means an investigation often cannot reproduce the failure to confirm a hypothesis.
What a self-healing loop requires
After a literature review across the self-improvement and prompt-optimization work, we concluded that a self-healing system needs at least three prerequisites, each answering a different question:
- Observability — full-fidelity capture of input, tool calls, intermediate steps, and outcome for every interaction. This determines what to investigate; richer traces yield better diagnoses.
- Grading — per-axis metrics and judges tied to the product and business specification. This determines why to investigate a session. Multi-agent failures don’t lie on a single axis, and one aggregate quality score rarely captures the failure, so we recommend setting up thorough LLM-as-a-judge panels.
- Monitoring — trend monitoring over those metrics. This determines when to investigate, and makes detection autonomous: triggered by an anomaly in the trend rather than on demand.
A well-engineered product typically has all three already, which is what makes automated diagnosis tractable. This project completes the package by describing how to investigate.
Implementation
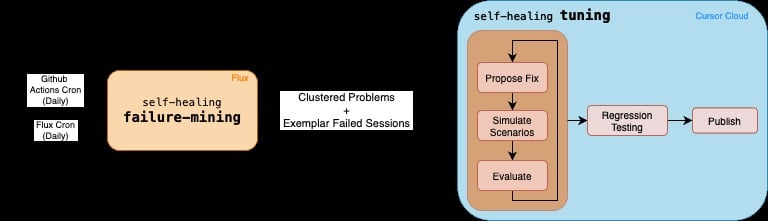
What follows is one design among many for converting observed failures into code and prompt patches. We split the loop into two stages. Mining finds and clusters failures and produces a per-trace diagnosis with causal chains and verbatim evidence. Tuning proposes a fix, simulates it, and checks for regression (Figure 9). The split is a context-budget decision: thorough diagnosis spends a large token budget on transcripts, prompts, and source, and sharing a window with fix generation starves both. This post covers mining.
Evidence for a single failure is distributed across the transcript, several system prompts, backend logs, and recent commits in more than one repository. Supplying all of it in one context window yields a confident and unfalsifiable summary. The diagnosis stage therefore draws on long-context reasoning techniques (adapted from published research on structured, multi-step reasoning over long context, arXiv:2510.04568), organized into three sequential phases: a Planner that hypothesizes, a fan-out of Workers that gather, and a Manager that adjudicates. Only the Manager is permitted to draw a conclusion.
- The Planner triages the transcript, LLM-as-a-judge verdicts, and compact execution signals. It does not conclude; it emits hypotheses and the questions that should be answered to confirm or refute them.
- The Workers each inspect source code, git logs, or one implicated prompt, and return verbatim evidence for their assigned questions only. Workers may not conclude. That constraint exists to keep the pipeline from becoming self-confirming.
- The Manager adjudicates the evidence into a per-session diagnosis: originating fault, propagation path, responsible agent, plausible fix location, and — where the fault is prompt-attributed — the implicated span quoted verbatim.
Because every handoff is a fixed contract, runs are diffable, reproducible, and extensible: a new evidence source is a new Worker. Two further design decisions proved consequential in practice.
- Session selection combines anomaly-driven and random sampling. Anomalies are detected by monitoring rather than by the pipeline itself. When an aggregate metric moves unexpectedly, monitoring triggers a run and passes that movement in as the presenting symptom to be explained. Random sampling of metric-graded sessions covers the complement: anomaly cohorts give precision on regressions, while a random subset gives recall on failures that never move a trend line.
- A deterministic execution-signal layer runs before any model call, reconciling trace export, judge output, and backend logs to recover truncation, empty generations, and orphaned tool calls that parsed transcripts silently absorb. It functions as a pre-screener and context enricher rather than a reasoning stage. Still, a material share of real defects fell into this class.
Finally, the Manager writes each finding into a fixed schema with causal chains, verbatim evidence, and categorization fields drawn from a published taxonomy of the ways multi-agent systems fail (Cemri et al., Why Do Multi-Agent LLM Systems Fail?, arXiv:2503.13657). The schema serves two purposes: it constrains what the Manager must justify, and it makes findings comparable and auditable across sessions. Comparable findings can then be embedded and clustered, so a proposed fix targets a family of sessions rather than a single trace.
Evaluating against off-the-shelf agent harnesses
A general-purpose agentic coding harness explores autonomously once invoked, but it doesn’t decide when to run, which sessions to pull, or which evidence to expose. Whether a bespoke pipeline is warranted beyond supplying those decisions is an empirical question.
To answer it, we evaluated four conditions along a spectrum from fully autonomous to fully customized (Figure 10). In what follows, “free agent” means a frontier coding model at high reasoning effort, running in an off-the-shelf agentic coding harness and left to explore on its own, and “schema-constrained” refers to the fixed output schema from the previous section.
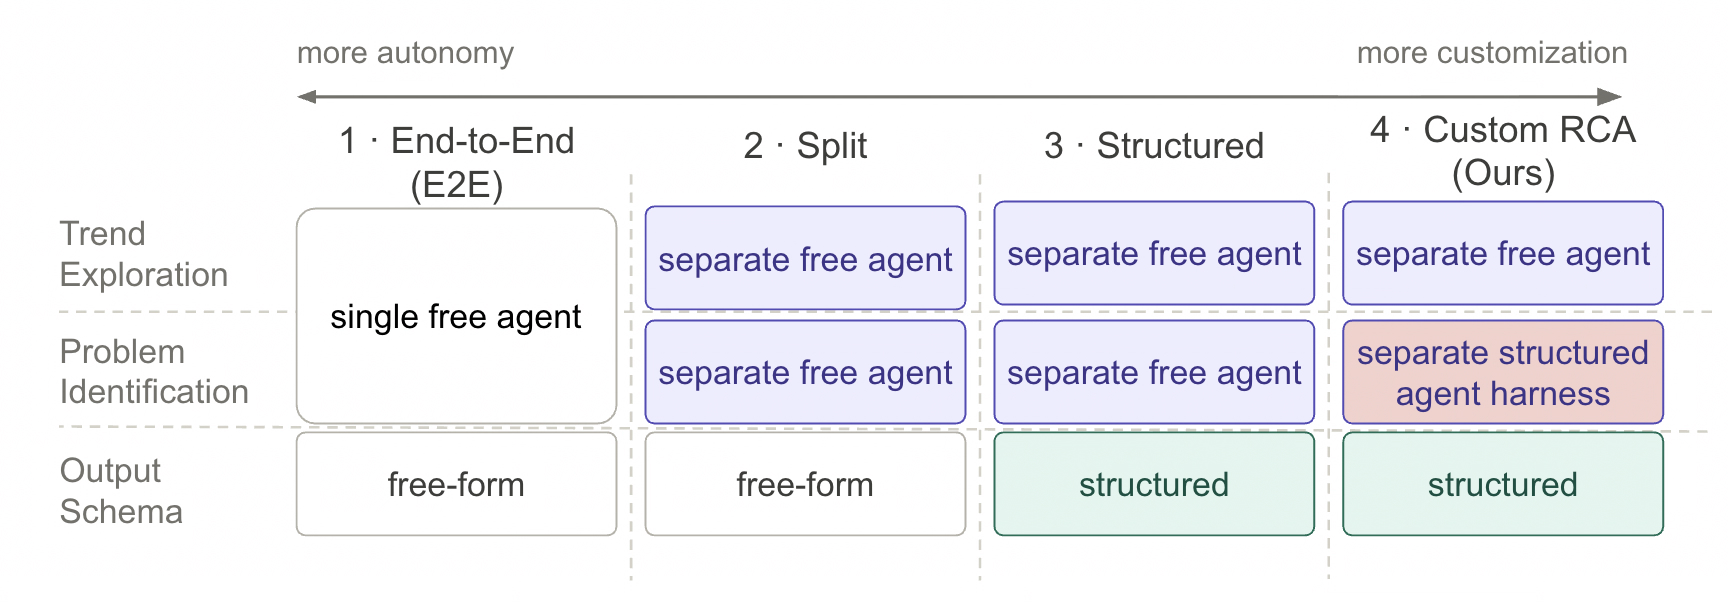
Evaluation used a production support-automation assistant, chosen for its wider failure surface: it issues more tool calls per session, spans a broader range of scenarios, and serves as its users’ primary mode of interaction rather than a secondary one. The setup was held constant across conditions. Each condition ran on two independent one-week windows of production traffic, so no result depends on a single week’s mix of problems. Every variant was replicated four times per window, since the harnesses are themselves stochastic and a single run captures little. A more capable judge model from a different model family scored each run from 1 to 5 on 10 axes, and a human reviewer corroborated the scores.
In the first window, the custom pipeline led clearly on output quality and groundedness, and cost more per run but less per transcript audited. Equal-weighted across all 10 axes, however, the simplest condition came out ahead (Figure 11). The two intermediate conditions behaved almost identically to each other and worse than both extremes, each fixating on the window’s headline anomaly — which turned out to be provider-side latency noise that no source code change could address. Splitting the work across agents didn’t make investigations deeper. Giving each agent a tightly scoped task did.
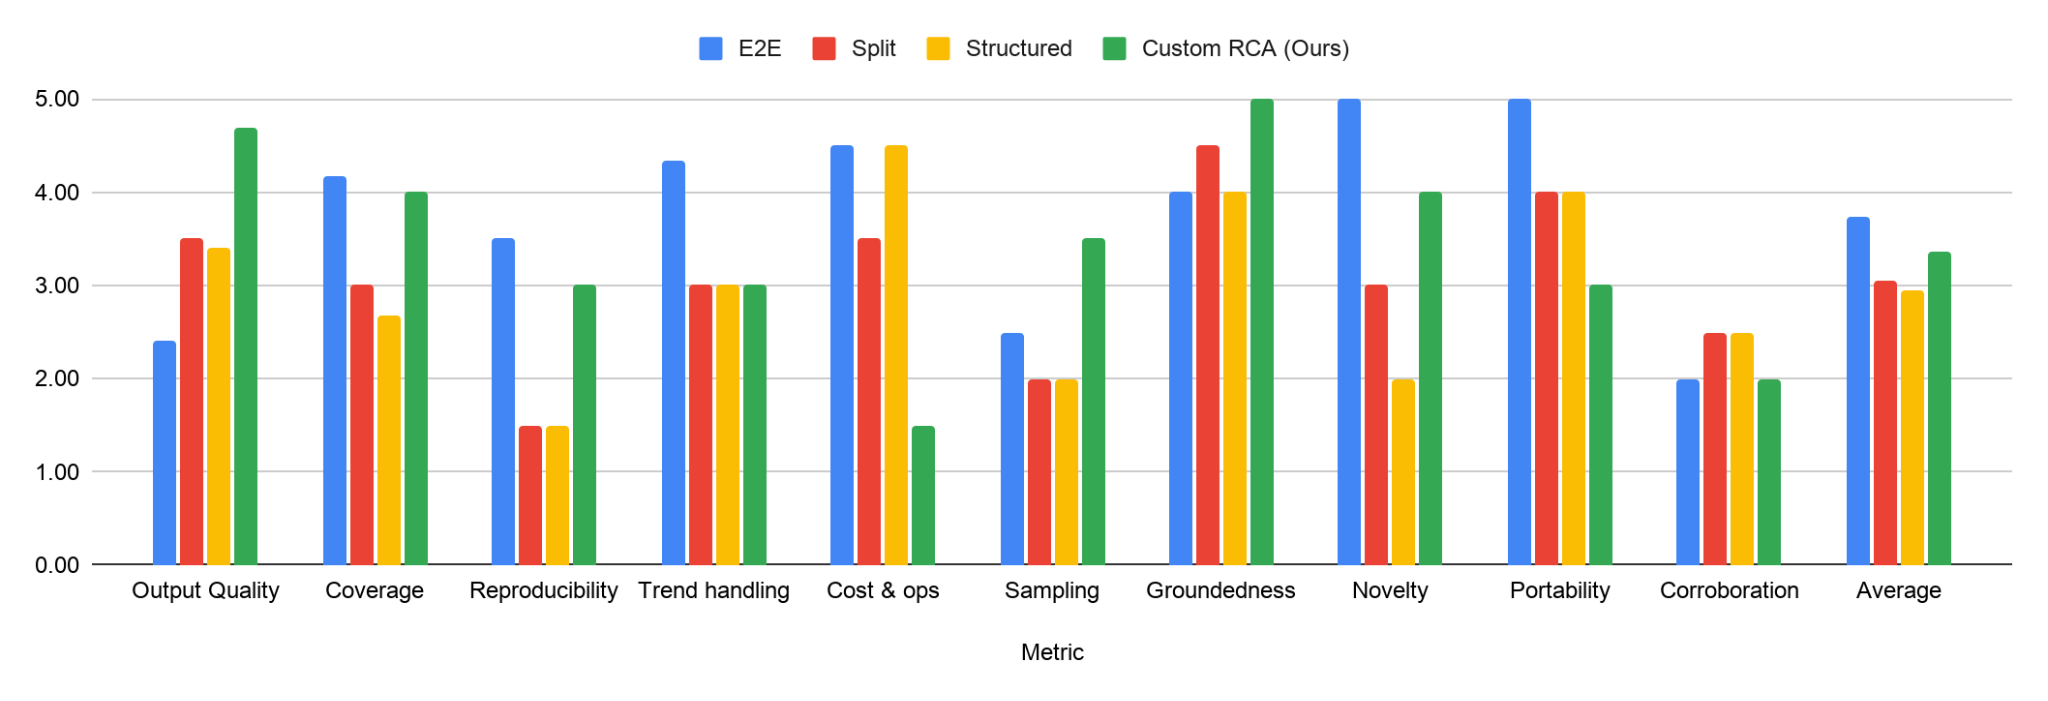
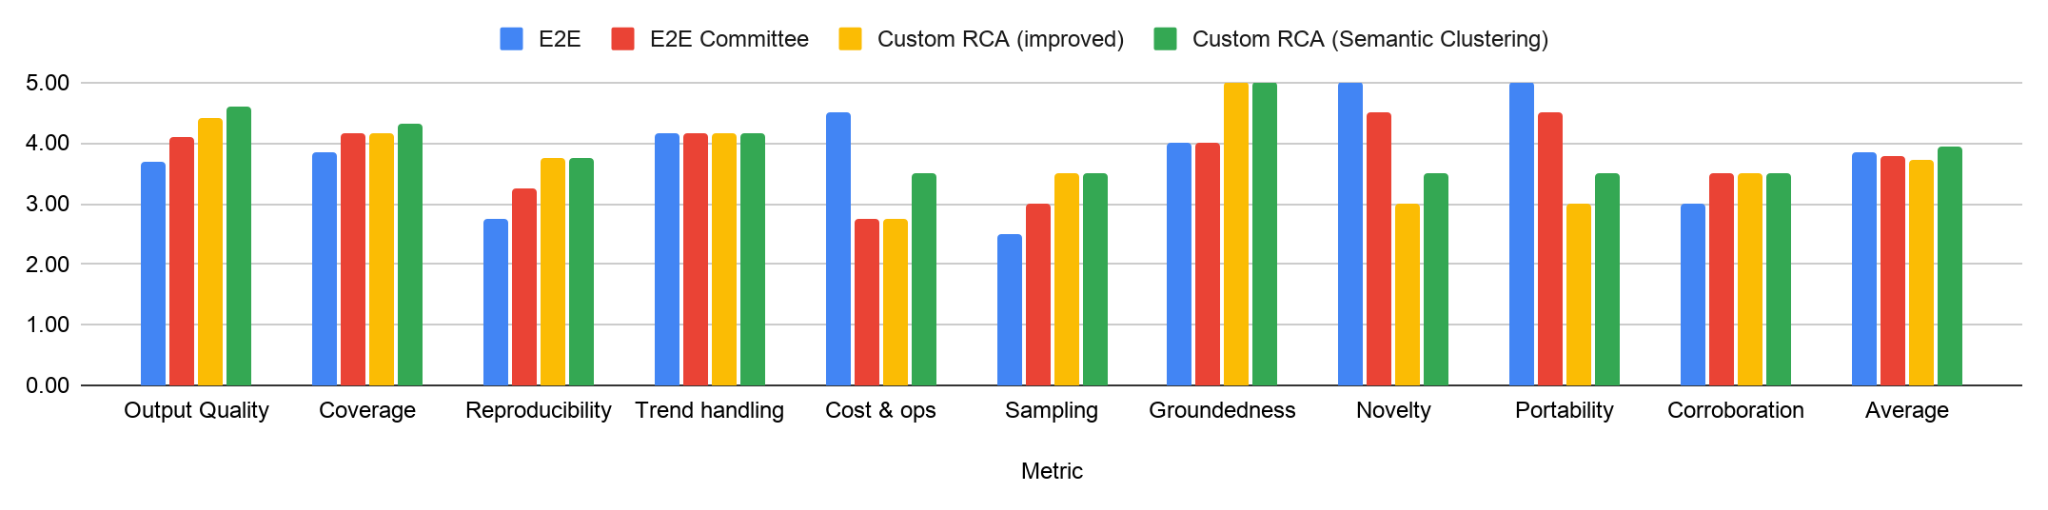
Reading the first window as a statement about where each method is strong, we improved the two leading contenders before the second. The end-to-end agent gained a committee variant, in which several independent runs investigate the same sessions and a model merges their findings into one report. The custom pipeline gained a final step that clusters findings by meaning, so related failures are grouped together.
In the second window the lead changed hands (Figure 12). The best configuration, custom RCA with semantic clustering, retained its designed advantages throughout: output quality, groundedness, and sampling robustness in both windows, plus reproducibility in the second. The end-to-end agent kept novelty and portability, and stayed cheaper per run.
Reflections and conclusion
Detecting that a multi-agent system has failed is largely a solved problem. Explaining the failure, in practice, still means an engineer reading transcripts until the cause turns up. This summer we set out to find whether that reading could be automated into a pipeline instead, and the answer turned out to be closer to yes than we expected.
The uncomfortable part is that neither evaluation window produced a clear winner between the free-agent harness and the structured pipeline. Both root-caused real failures, and neither did so decisively better than the other. We attribute that to the stochasticity of the evaluation data and the varying complexity of the problems each window surfaced, rather than to a defect in either method. Three conclusions follow.
- Off-the-shelf agent harnesses are already capable of root-causing agentic failures today.
- A customized structure still adds provenance, specificity, and thematic stability, at the cost of portability. Every finding attaches to a session, a causal chain, and a named fix location, and one defect family ranked first or tied for first in all eight structured replicates.
- Constraining a free agent’s output raises its quality but cuts its novelty and coverage sharply. This comes from the two intermediate conditions in the first window. The implication is that a schema helps at the reporting step and hurts at the exploration step.
So rather than a single verdict, we propose that the choice follow an audit of the business need. The audit asks three things: how deeply the evidence for a failure is distributed, how far a finding has to hold up under review, and how much novelty, groundedness, and cost matter for the product in question.
The more useful observation is that these approaches are not mutually exclusive, and each one’s strength can improve the others. Three transfers are apparent. Dynamic sampling of traces is what the free agents do well. Importing it into the structured pipeline is the most direct route to closing the novelty gap, since a fixed pre-pulled sample is what created that gap in the first place. And applying a structured output schema to a free agent’s reporting step is a prompt change that recovers much of the quality and auditability difference. The deterministic execution-signal layer transfers just as easily, since it runs before any model call and any harness can consume it.
A team can therefore start simple and adopt the elements in this post selectively. The elements are: a dedicated hypothesis-driven analysis step, independent evidence-gathering agents, a structured output schema at the reporting boundary, a fixed handoff contract between agents, and dynamic sampling of the sessions worth investigating. Longer term, as a product matures and its failure modes become specific to it, the pipeline can be customized around those modes and can eventually generate its own evaluation scenarios and audit its own results, with an engineer approving each change. That’s the path from self-healing toward self-improvement.
Acknowledgments
This project would not have been possible without the guidance of my manager, Jianzhe Luo, and my mentors, Hubert Jenq and Daniel Chiu. I’m also grateful to the entire team, whose conversations and code reviews taught me a great deal over the course of the summer. Finally, my thanks to everyone at DoorDash and in the university program for making this such a rewarding internship.
Stay Informed with Weekly Updates
Subscribe to our Engineering blog to get regular updates on all the coolest projects our team is working on