





How a reusable benchmark fleet made Triton configuration measurable across hundreds of production and shadow models, with mean QPS lift rising from 1.75x at 4 vCPU to 6.78x at 32 vCPU.
DoorDash Engineering / 10 minute read / Draft
Part 1 of a multi-part series. This installment covers CPU-backed Triton models. A follow-up post will cover how we are extending the system to GPU inference.
On one production model, the same artifact running on the same 32-vCPU pod delivered either 68 QPS or 863 QPS depending only on its serving configuration. After tuning, p99 latency fell from 126 ms to 14 ms and CPU utilization fell from 67% to 16%.
| 1.75-6.78xmean QPS lift from instance scaling, by CPU tier | Hundredsproduction and shadow models supported | 20.1% vs 0%severe regression rate, one instance vs one per vCPU | 252reusable benchmark pod slots |
|---|
When More CPU Made Models Slower
At DoorDash, PyTorch models run on NVIDIA Triton Inference Server across use cases such as search, ranking, dispatch, fraud, and ads. Each model has several serving choices: CPU architecture, pod size, Triton instance count, OpenMP thread count, and request concurrency. A reasonable default for one model can waste capacity or violate latency targets for another.
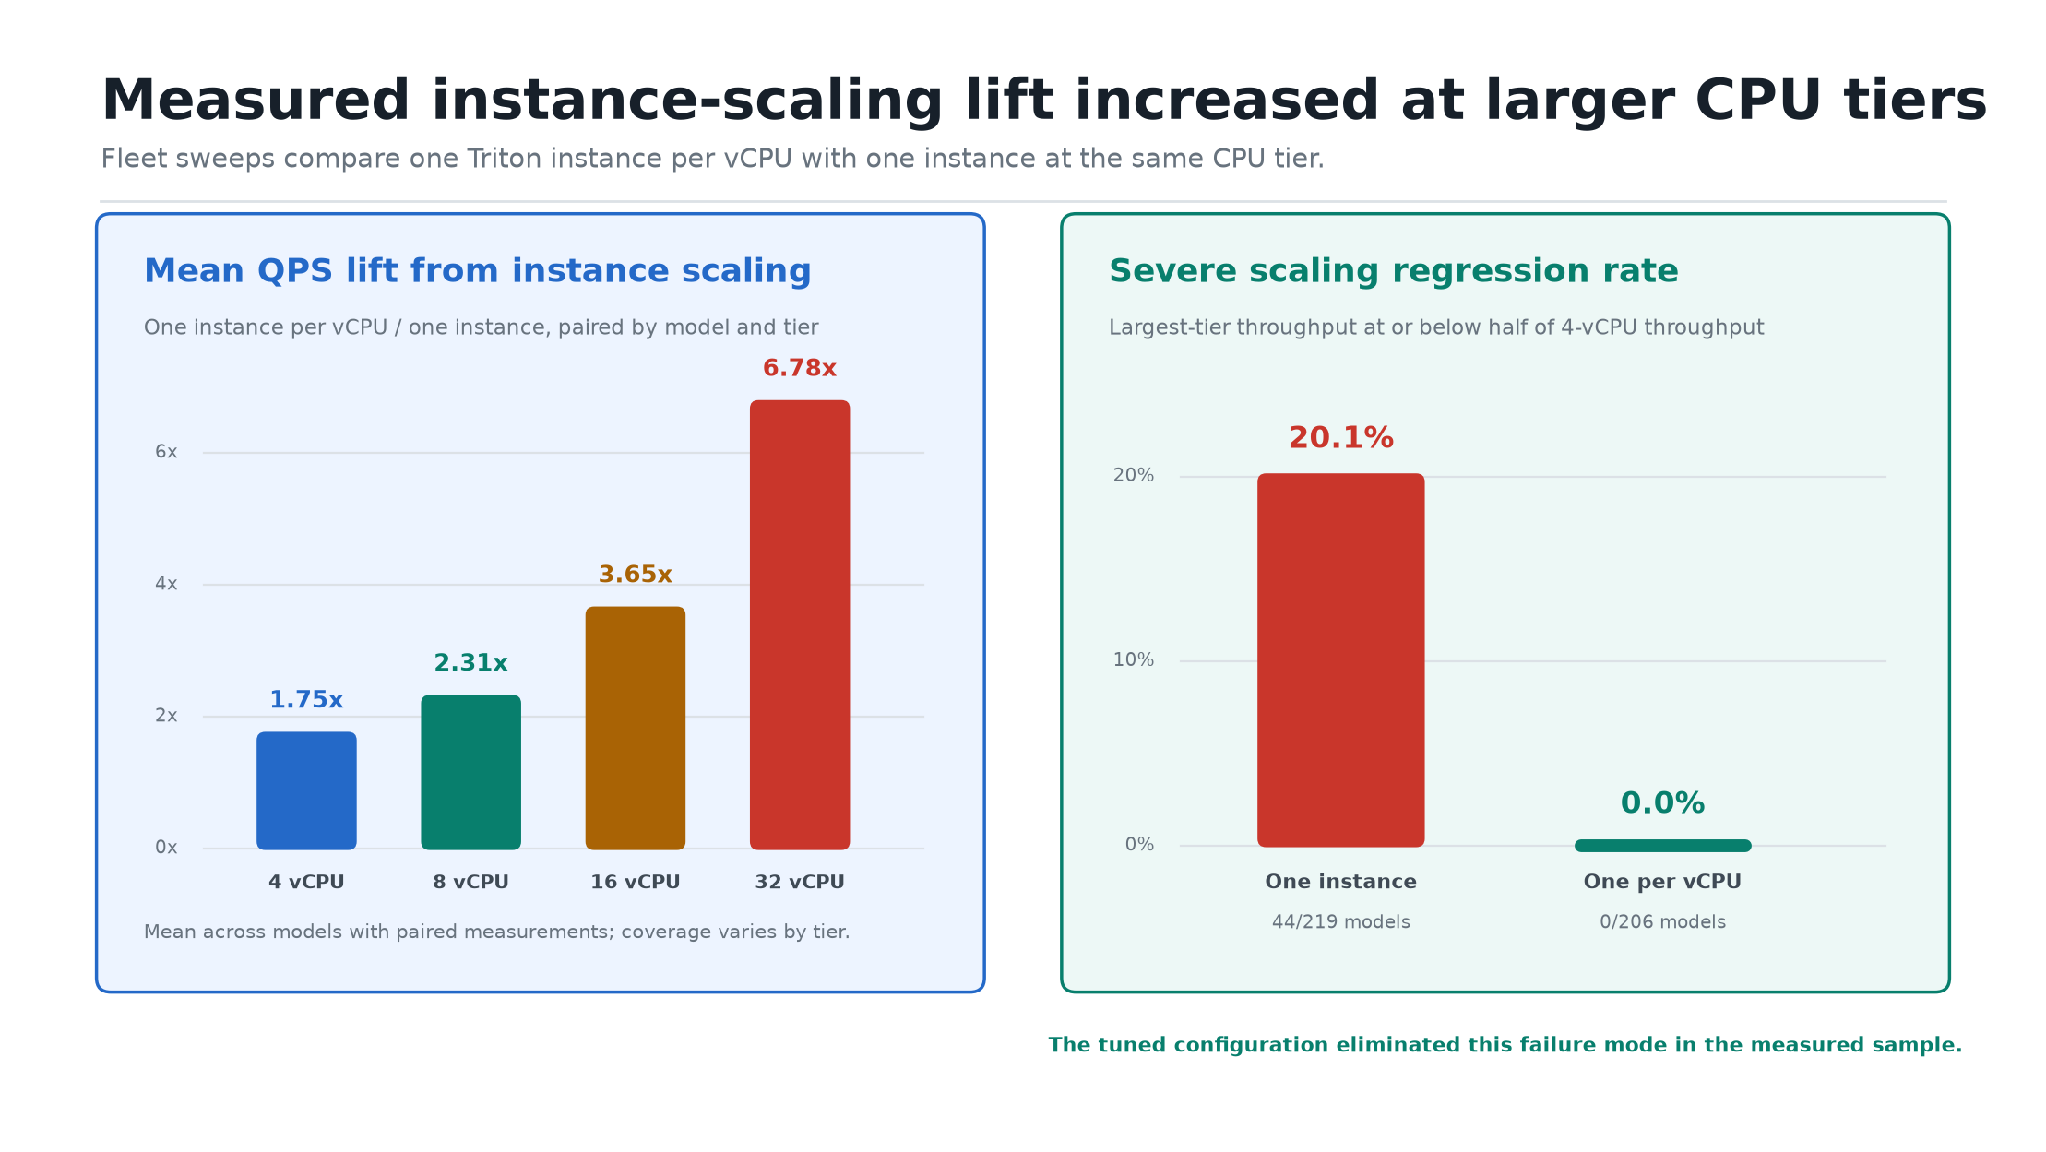
The refreshed analysis included 264 models with usable sweep data. Among models with comparable single-instance results, 44 of 219 fell to half or less of their 4-vCPU throughput at the largest swept tier. Among 206 models with comparable one-instance-per-vCPU results, none did.
The mistake was treating pod size as the main performance decision. In practice, pod size interacts with the number of Triton model instances and the number of threads used by each instance. More cores can create more contention when those settings are not coordinated.
Which complete serving configuration delivers the required throughput and latency at the lowest resource cost?
Answering that question for one model is a benchmark. Answering it consistently across hundreds of models requires a system.
A Reusable Tuning System
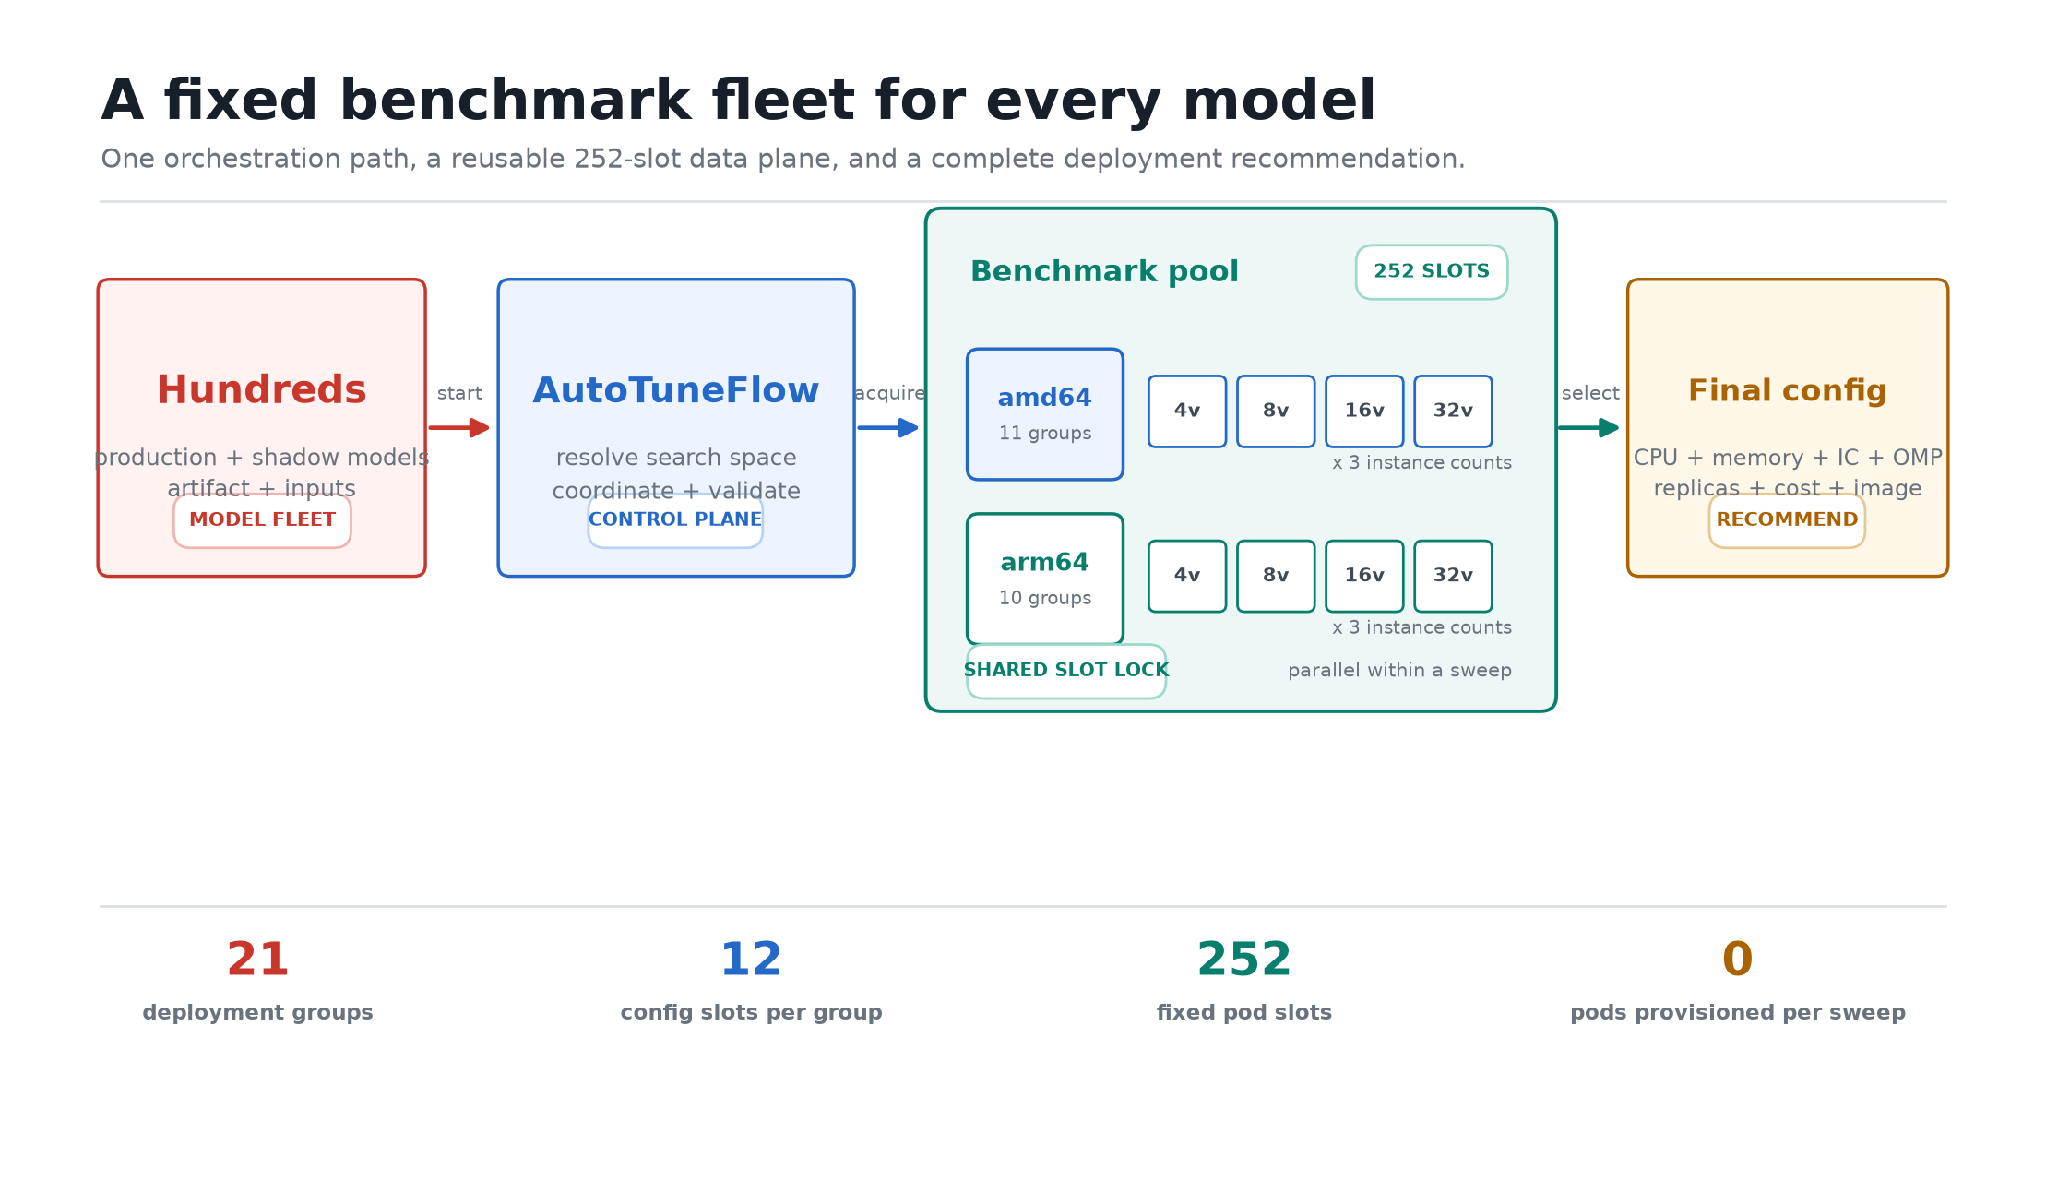
We built an auto-tuning platform that benchmarks production model artifacts and representative inputs against a controlled configuration matrix, then selects the lowest-cost configuration that meets the model's latency and capacity requirements.
- Orchestration
An AutoTuneFlow resolves the model artifact, representative inputs, production traffic, latency target, and candidate configuration matrix. - Measurement
A shared benchmark pool runs the candidates on the same Triton runtime used in production and records throughput, latency, and cgroup CPU utilization. - Selection
The flow rejects candidates that miss latency or CPU limits, combines the remaining capacity measurements with production QPS, and emits deployment overrides.
Model teams do not need to understand the mechanics of the benchmark pool, and the measurement layer does not need to know the business context behind a model's latency target. The orchestration layer joins those concerns into a production-ready recommendation.
A Fixed Pool Instead of Per-Model Infrastructure
Each deployment group contains 12 dedicated slots covering four CPU tiers (4, 8, 16, and 32 vCPU) and three Triton instance counts for each tier. A sweep acquires one available group and runs the tier and instance-count combinations in parallel. Different models can use different deployment groups at the same time.
An S3-backed lock coordinates access. If a group is busy or unhealthy, the orchestrator moves to another available group. This gives us two kinds of parallelism: candidates run concurrently within a sweep, and multiple models can be tuned concurrently across the shared fleet.
The fixed 252-slot pool supports tuning across hundreds of production and shadow models. Growing the number of models increases utilization of the platform, not the infrastructure required for each individual run.
Benchmark with NVIDIA's perf_analyzer
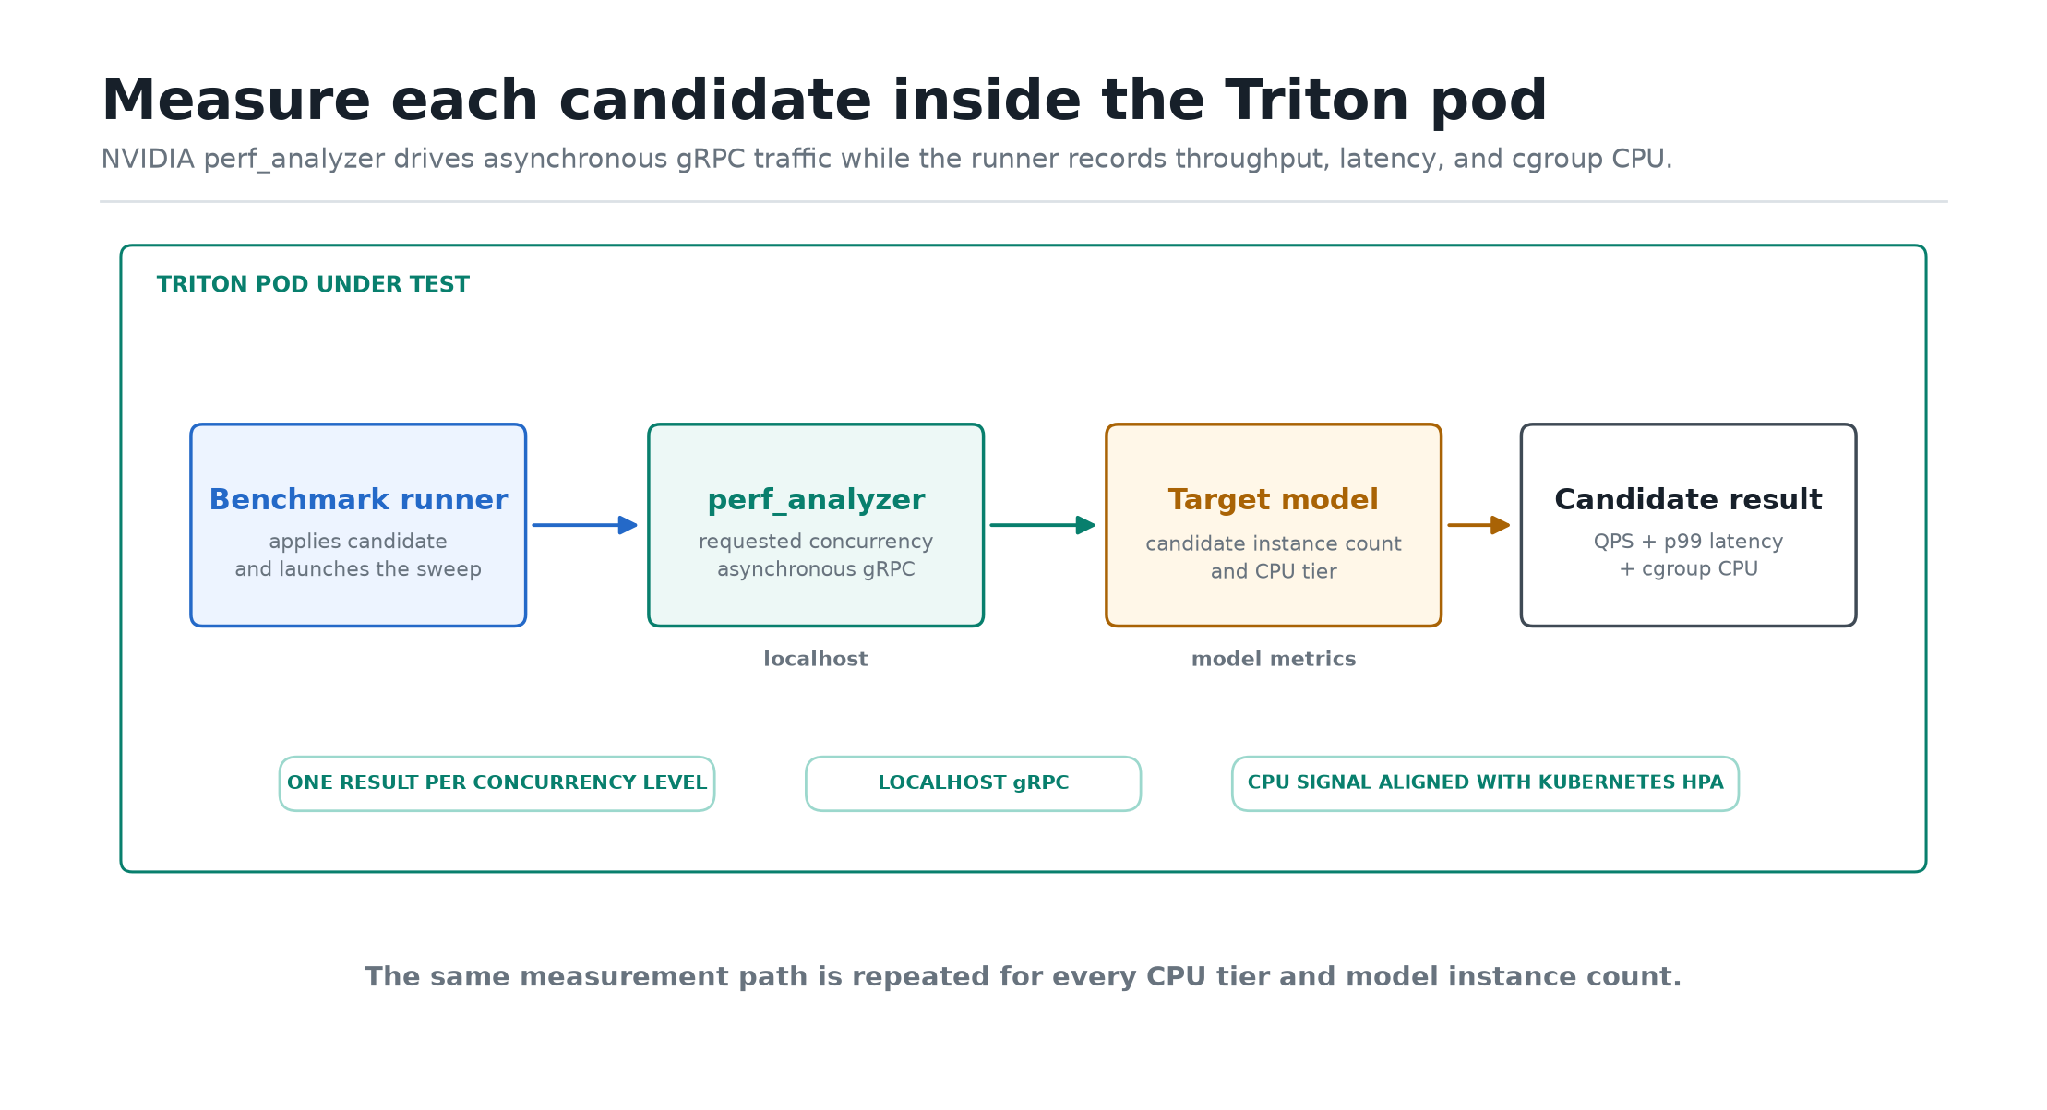
Each benchmark pod invokes NVIDIA's perf_analyzer through a small benchmark model running alongside the target model. perf_analyzer sends asynchronous gRPC requests over localhost at each requested concurrency level, while the runner records throughput and latency and reads the pod's cgroup CPU counters. This produces one consistent measurement of QPS, p99 latency, and the same CPU signal that Kubernetes HPA sees.
Reconfigure Triton Without Restarting Pods
The benchmark pods run Triton in explicit model-control mode. For each candidate, the tuner loads the target model through Triton's model-control API and passes the candidate ModelConfig as an override. It can then unload the model and reuse the pod for the next sweep.
That lifecycle avoids an S3 edit, repository polling delay, or pod restart for every candidate. A single measurement follows the same sequence:
- Acquire a benchmark group.
- Load the benchmark runner and target model.
- Validate the inputs and warm the model.
- Run perf_analyzer across concurrency levels.
- Record QPS, latency, and CPU measurements.
- Unload the model and release the group.
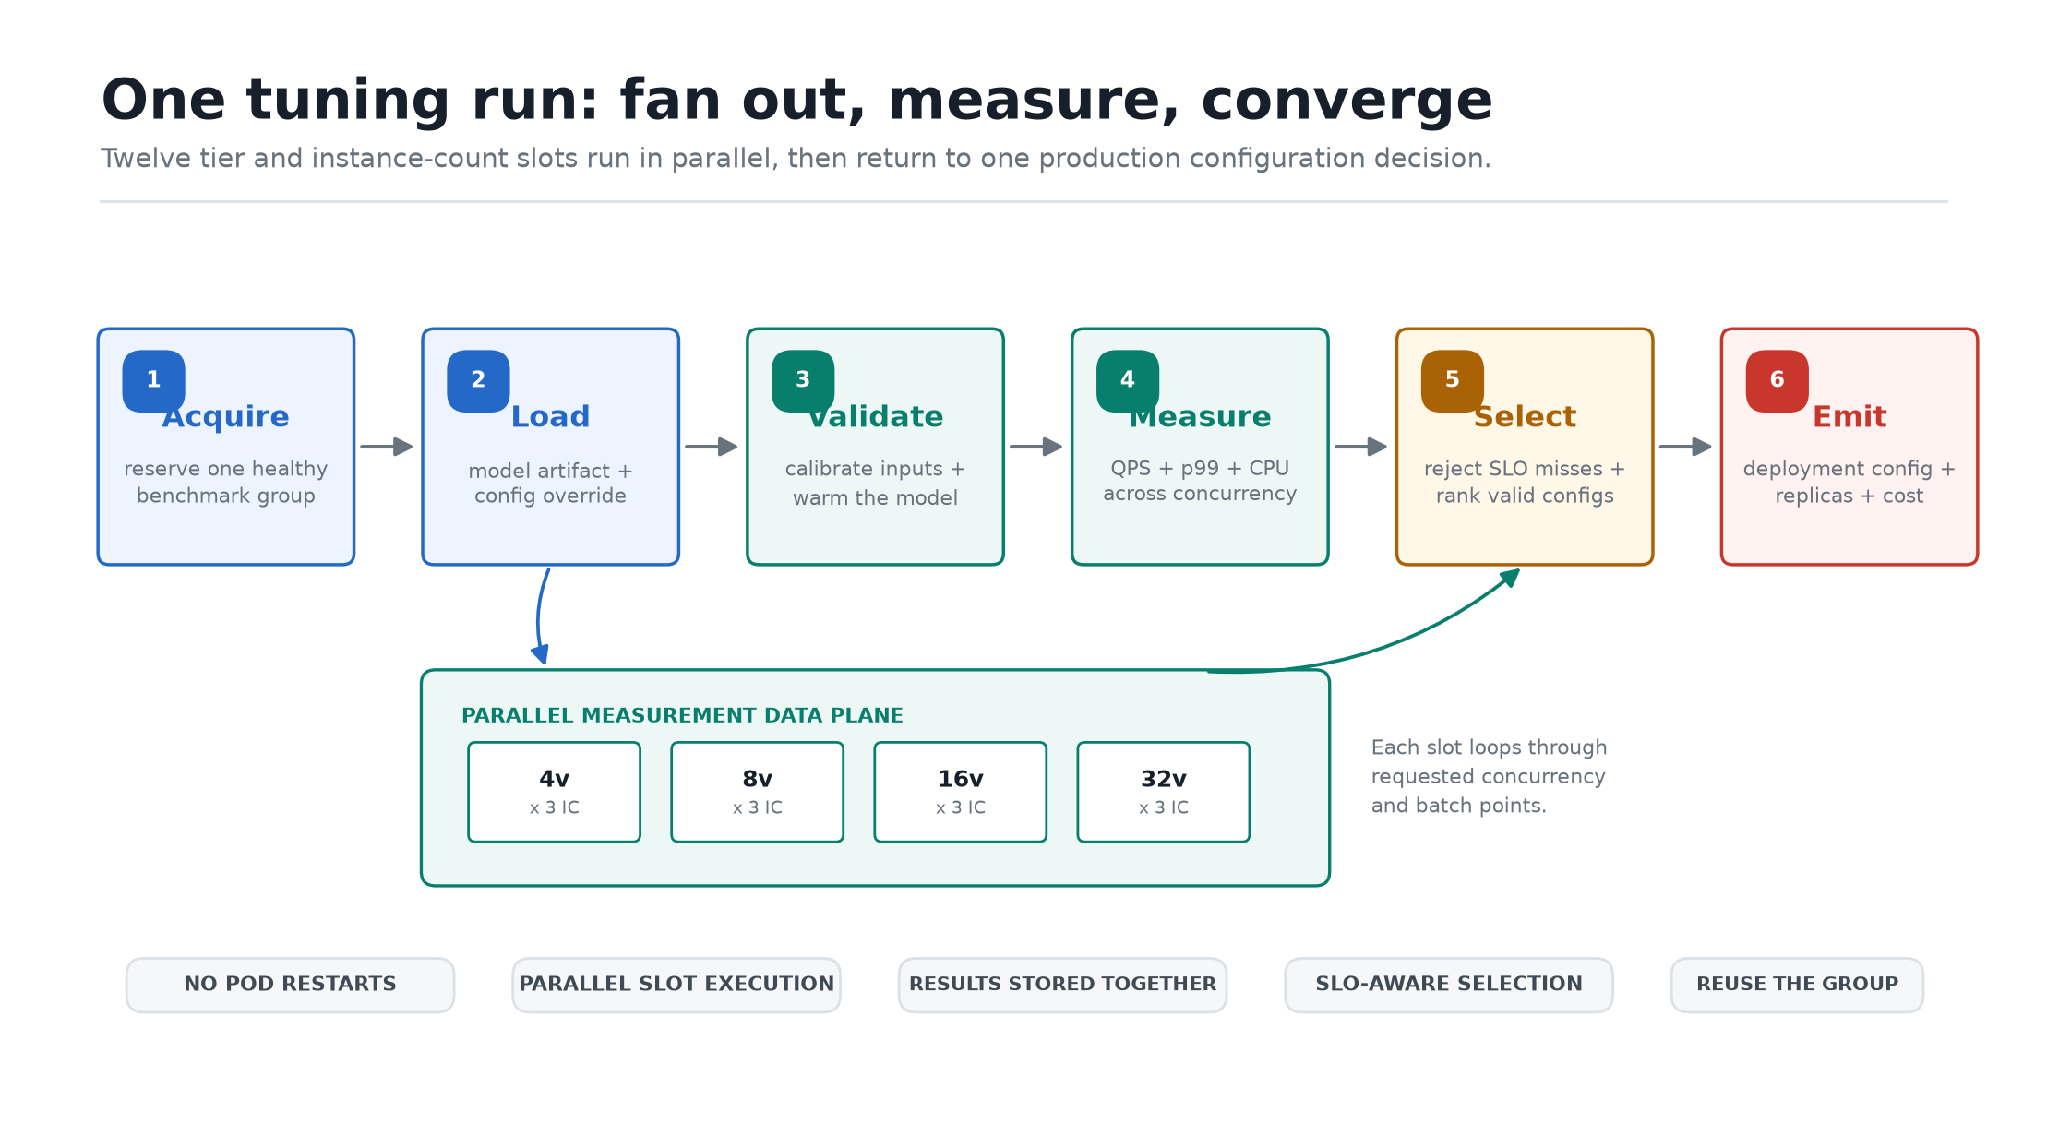
The exact number of measurements depends on the CPU architectures, tiers, instance counts, batch sizes, and concurrency levels requested. Because the expensive tier and instance-count combinations run in parallel, expanding the search matrix does not translate directly into wall-clock time.
Why Configuration Changed Performance So Much
PyTorch CPU inference has two forms of parallelism. Triton can run several copies of a model in parallel, while each copy can use several OpenMP threads within an inference. These controls are useful individually, but they must be tuned together.
The out-of-the-box pattern on an N-core pod is often one Triton instance using N threads. For many of our models, a better pattern was N single-threaded instances:
instance_group.count = vCPU
OMP_NUM_THREADS = 1
OMP_DYNAMIC = FALSE
INTRA_OP_THREAD_COUNT = 1
This turns a single highly threaded inference worker into multiple independent workers. It also avoids the worst case, where multiple Triton instances each create a full-size thread pool and compete for the same cores.
The tuner therefore treats instance count and thread count as one configuration decision. In general, it keeps:
instance_group.count x OMP_NUM_THREADS ~= vCPU
The choice between more instances and more threads is still model-dependent, which is why we measure it rather than hard-code one fleet-wide answer.
| Configuration | QPS | p99 latency | CPU |
|---|---|---|---|
| 1 instance, 32 threads | 68 | 126 ms | 67% |
| 32 instances, 1 thread each | 863 | 14 ms | 16% |
Across the refreshed analysis, comparing one Triton instance per vCPU with a single instance at the same tier produced mean raw QPS lifts of 1.75x at 4 vCPU, 2.31x at 8 vCPU, 3.65x at 16 vCPU, and 6.78x at 32 vCPU. The model artifact and hardware tier stayed the same; only the serving configuration changed.
PyTorch's CPU threading documentation describes the interaction between inter-op and intra-op parallelism in more detail.
What We Learned Across the Fleet
Let the Sweep Choose the CPU Tier
The refreshed 264-model analysis selected 4 vCPU most often at 71.8%, followed by 8 vCPU at 14.9%, 16 vCPU at 10.2%, and 32 vCPU at 3.1%. Larger tiers won for 28.2% of models.
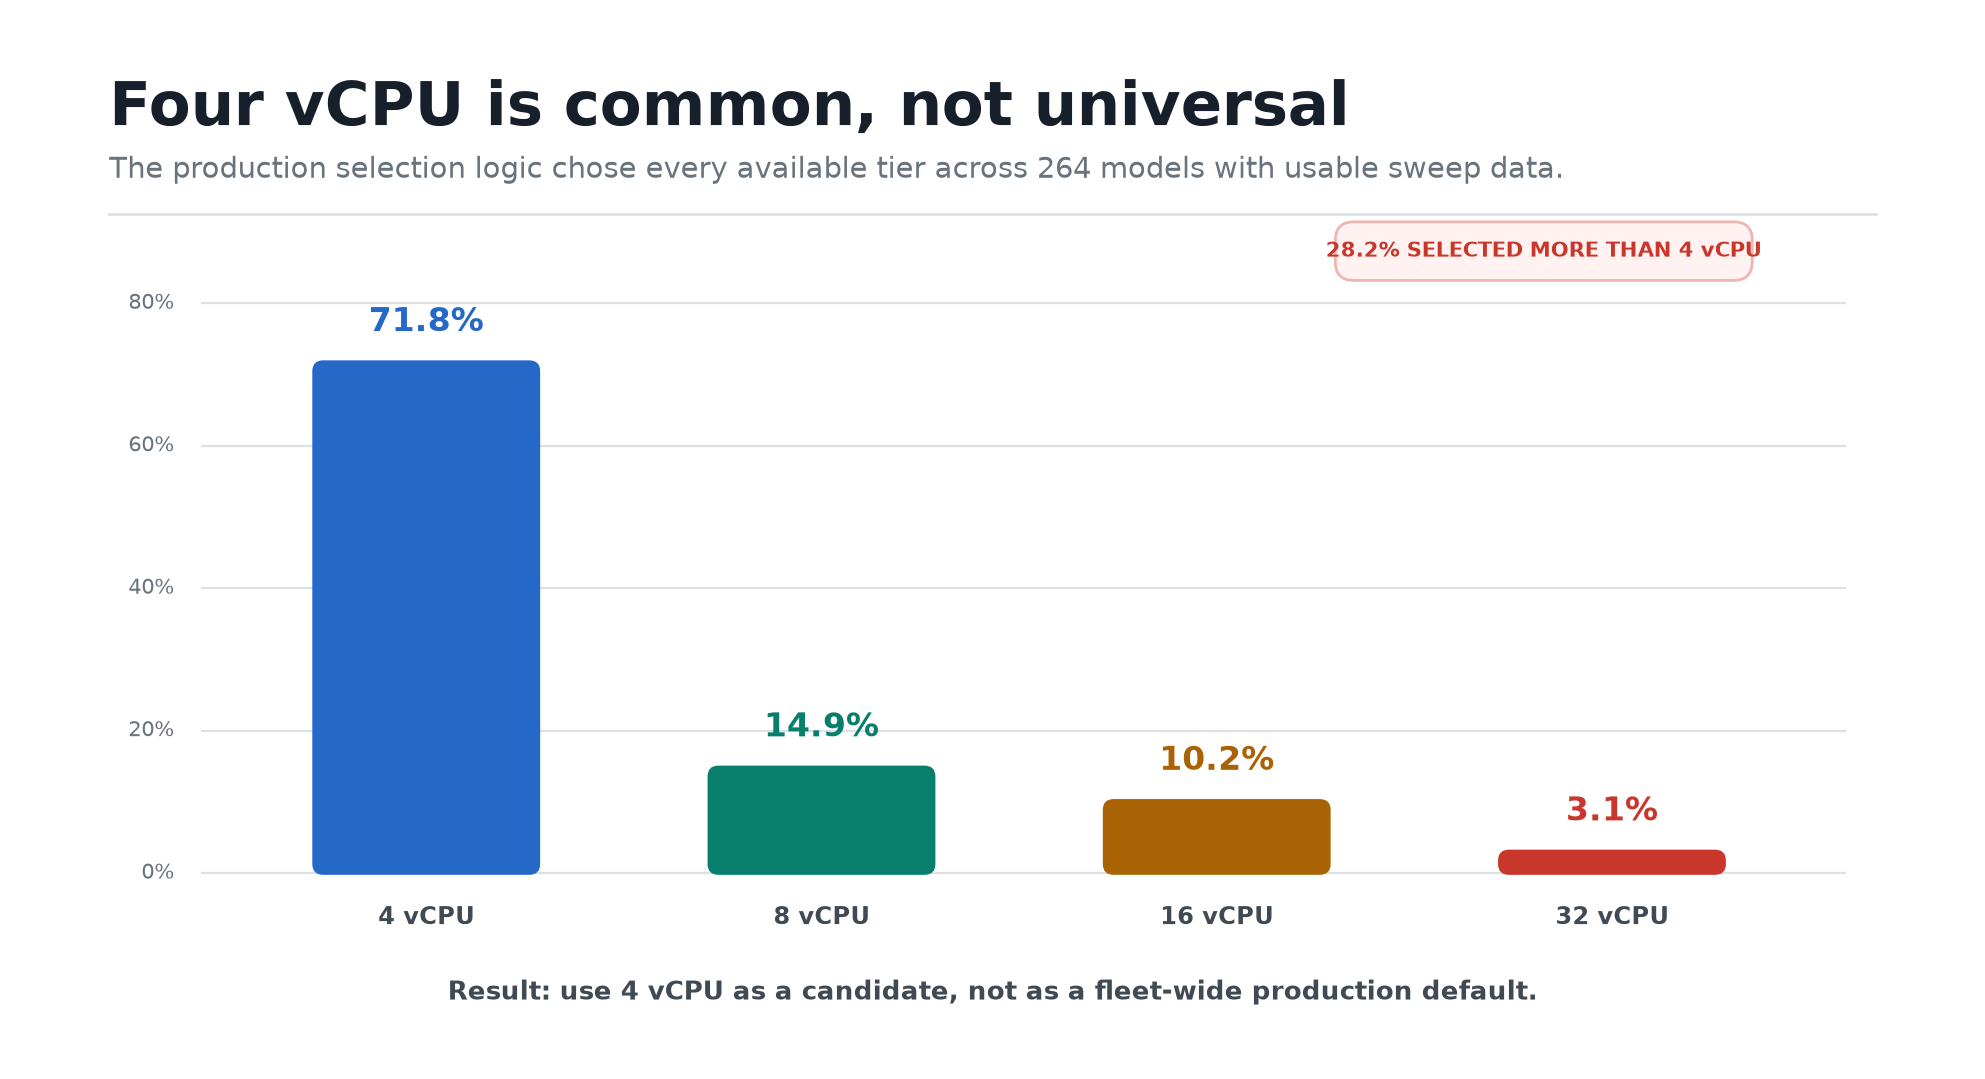
Four vCPU is a useful starting candidate, not a production default. The tuner evaluates the available tiers and selects the one that delivers the best cost-adjusted capacity while meeting the model's latency target.
CPU Alone Does Not Always Describe Saturation
Kubernetes HPA commonly estimates capacity by scaling observed throughput in proportion to CPU utilization:
predicted QPS = current QPS x (target CPU / measured CPU)
That works when CPU is the limiting resource. It fails when throughput plateaus first. In one 8-vCPU test, CPU leveled off at 26%, so a 40% HPA target implied 1,252 QPS of capacity. The model saturated at 829 QPS, a 1.5x overestimate.
Triton exposes queue signals such as nv_inference_pending_request_count and queue duration, which describe saturation more directly. We are moving toward an autoscaling signal that combines CPU with queue pressure.
From Benchmark Result to Production Configuration
The tuner does more than rank benchmark rows. It combines measured per-pod capacity with the model's production QPS range, calculates replica requirements and projected cost, validates the proposed change, and produces the deployment overrides consumed by the delivery workflow.
- CPU architecture and vCPU tier
- Memory allocation
- Triton instance count
- OpenMP thread settings
- Expected QPS and p99 latency
- Minimum and maximum replicas
- Serving image
- Projected cost
This closes the gap between a benchmark and an operable production configuration. It also makes the recommendation reproducible: the measurements, selected configuration, and cost inputs are stored together instead of living in an engineer's notebook.
Supporting Platform Migrations and Continuous Training
The tuner now supports two recurring platform workflows. During platform migrations, it gives each model a measured configuration for the target serving environment instead of carrying forward assumptions from the previous platform. The same integration lets continuous-training workflows re-evaluate new model artifacts as they are produced, so serving settings can evolve with the model.
Both workflows use the shared benchmark pool and the same selection logic. This gives migration and retraining a consistent performance-validation path without requiring model teams to build separate benchmarking infrastructure.
The Broader Lesson
Serving configuration is part of model performance. Retraining and code optimization matter, but neither is required to recover capacity lost to runtime defaults.
At fleet scale, the important capability is not a single rule such as "use 4-vCPU pods" or "set OpenMP to one." It is a repeatable system that can test those assumptions against every model, under consistent conditions, and turn the result into a deployable configuration.
For our fleet, that system found mean QPS lifts ranging from 1.75x to 6.78x across CPU tiers, showed why CPU tier must be measured per model, and replaced manual sizing with a shared tuning path that scales across hundreds of models. The benchmark pool stayed fixed as the number of models using it grew.
What's Next
This first post focused on CPU-backed Triton models. In the next installment, we will cover how we are extending the same auto-tuning workflow to GPU-backed models, including the GPU configuration space, accelerator-specific capacity signals, and the changes required in the measurement layer. The orchestration and selection layers remain reusable, giving GPU models the same repeatable path from model artifact to validated production configuration.
Acknowledgments
- ML Serving Platform Arvind Kalyan, Kyoungah Kim, Haifeng Geng, Emmanuel Khayat, Jeffery Ni, Songze Li, Teer Ying, Feijin Deng, Zhe Liu, Zhengyang Wang
- Ads ML Team Utsaw Kumar, Kin Sum Liu, Benjamin Yang, Praveen Gondhi
Stay Informed with Weekly Updates
Subscribe to our Engineering blog to get regular updates on all the coolest projects our team is working on