
At DoorDash, our software engineering internship offers a hands-on and meaningful experience. With responsibilities that go beyond training exercises, interns become true members of our Engineering teams, directly contributing to projects that support Dashers, merchants, consumers, and employees across the company. This post is part of a 4-part series highlighting the technical accomplishments of our Summer 2025 interns - check out Part 1 and Part 3.
DoorDash’s Merchant Support Hub: Centralizing the support experience
By Pascal Bell
Customer support is an integral part of running a successful business. With DoorDash’s three-sided marketplace, we must provide quality support for merchants, Dashers, and consumers. While merchants on DoorDash are generally satisfied and likely to recommend the service, we want to ensure they continue to receive the support they need. In fact, support is a direct contributor to merchant loyalty and satisfaction.
This summer, I worked to build new features in the merchant portal that would improve the support experience. Specifically, I worked on developing Support Hub to surface email content and enable support case replies on the merchant help page.
Identifying merchant support issues
Before Support Hub, there were three main concerns regarding the experience in merchant support cases:
- Lack of visibility: Merchants had no way to know their case details, including case status and activity, without calling support, which can be time-consuming on both sides of the equation.
- Fragmented communication: It’s difficult to track emails from multiple support agents across many cases through inboxes; in many instances, merchants became unresponsive.
- No direct contact: Merchants were unable to contact their relevant support agent directly and instead had to wait for the agent to contact them first.
Positioning Support Hub as a solution
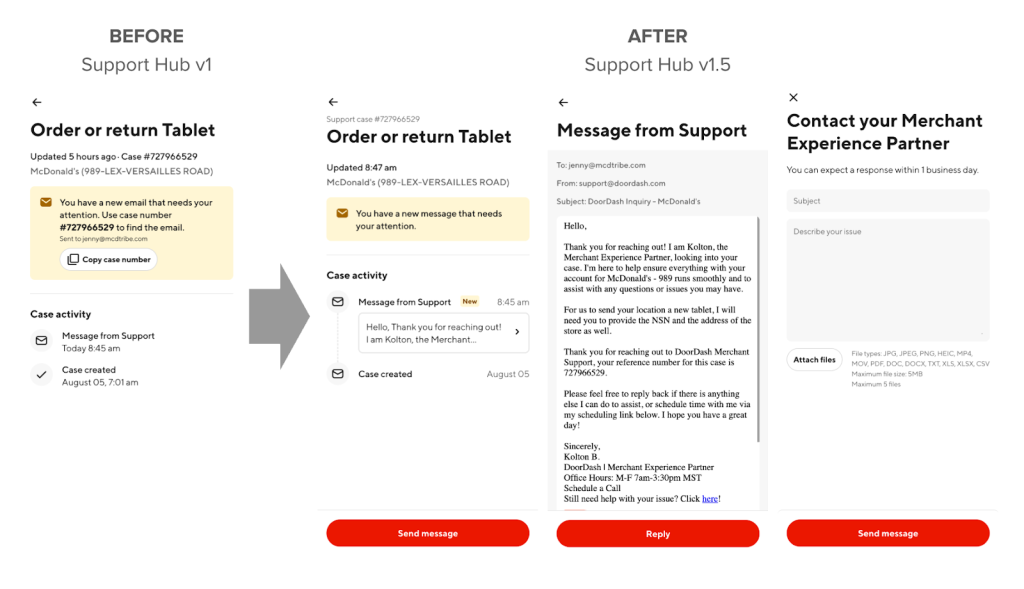
My team built the initial merchant support page, Support Hub v1, to improve visibility and allow merchants to see their case status online. Beyond displaying all cases and their status, however, Support Hub v1 lacked any functionality to allow merchants to interact directly with their support cases. This summer, I built three main features into Support Hub v1.5 that help to resolve merchant support issues.
- Surfacing email content: Merchants can now turn to Support Hub to view all emails related to their case; there is now a single point of entry into all support cases and emails.
- Unread indicator: A user-specific alert indicates whether a message has been read. This lets merchants easily identify new instructions, messages, and actions requested from support.
- Reply to emails: Merchants now can user Support Hub to send messages with attachments to their support agent, enabling frictionless communication. I focused on the backend changes for this feature.
Below, Figure 1 shows the visual change from Support Hub v1.0 to v1.5.
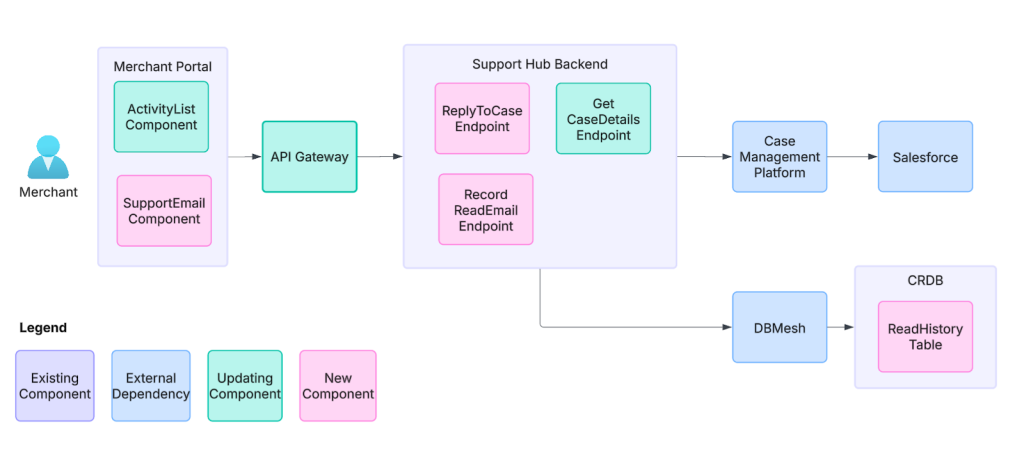
In the next figure below, Figure 2 provides a high-level overview of the architecture involved and my contributions.
Addressing technical challenges
I encountered the following key challenges while developing these features.
Email display using an inline frame, or iframe
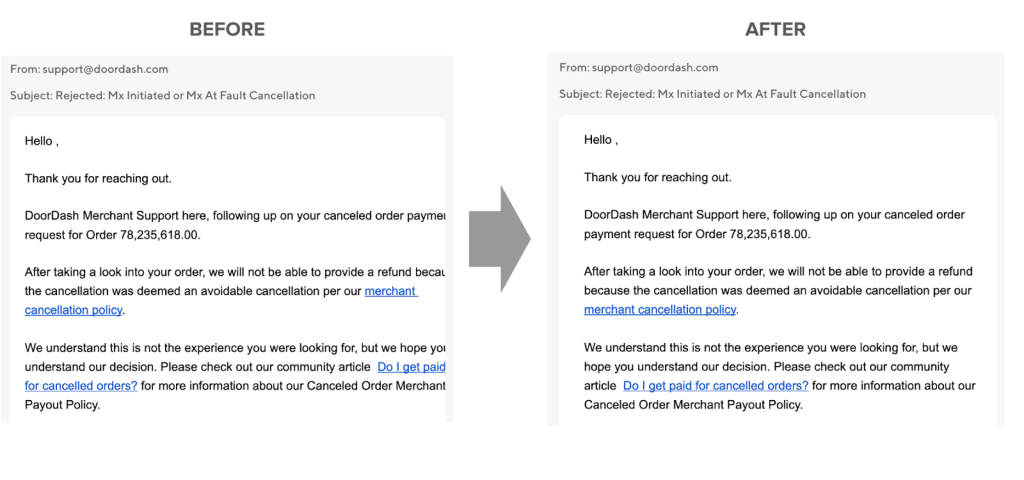
To display email content on the user interface, I used an iframe component to embed the raw email HTML. Because there are a variety of email templates used by support agents and email providers used by merchants, each email would render with unique dimensions within the iframe. To ensure a standard display across all emails, my solution, as shown in Figure 3, was to inject custom cascading style sheets, or CSS, into the raw email HTML to enforce a consistent width, height, and margin.
Parsing email HTML body
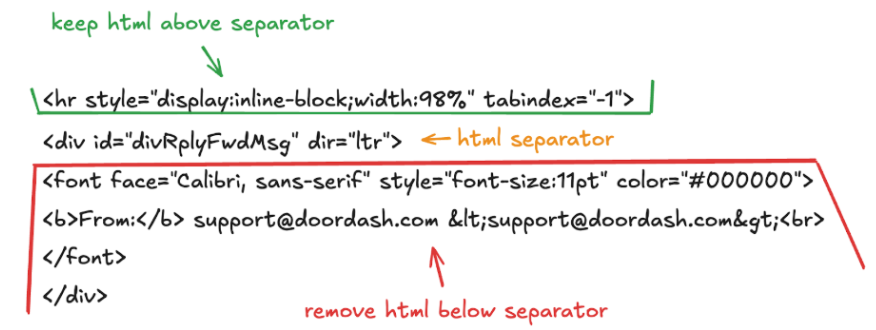
When replying to an email, most email providers will append the entire communication chain underneath the reply, resulting in a lengthy hidden thread. To avoid distraction within our UI, however, we only wanted to display the first email reply and not the remaining thread. Because each email provider formats threads differently, I built a regular expression (regex) parser that identifies the earliest split in the email thread based on common HTML separators.
Setting up a new CockroachDB (CRDB) table
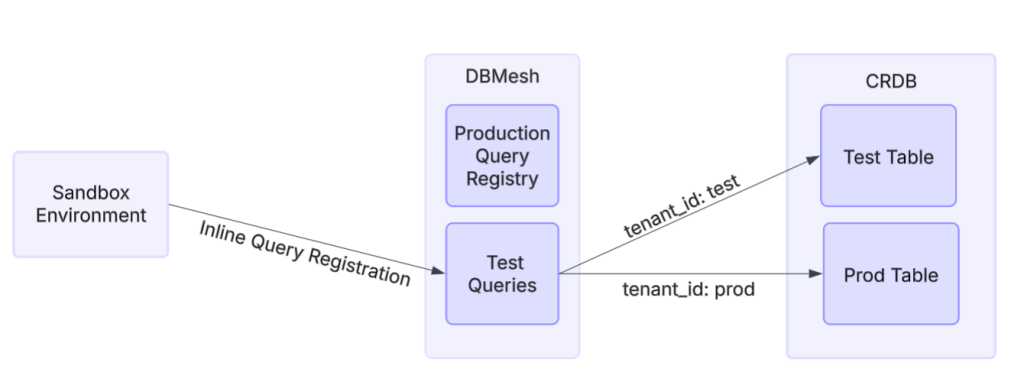
Because we wanted to track the message read history for our new indicator, we needed to create a new database table with read and write permissions in our CRDB cluster. To enable testing in the sandbox environment, I used DoorDash’s DBMesh service to enable table-level multi-tenancy in which different tenants as illustrated in Figure 5 — essentially environments such as test and production — have separate tables while sharing the same database. By injecting a baggage header with the relevant tenant ID into each request, I could control whether production or test data was used in the sandbox. Then I was able to test new SQL queries using DBMesh’s inline query registration feature, which registers test database queries without needing to update the central query registry upon which production relies.
Testing with downstream dependencies
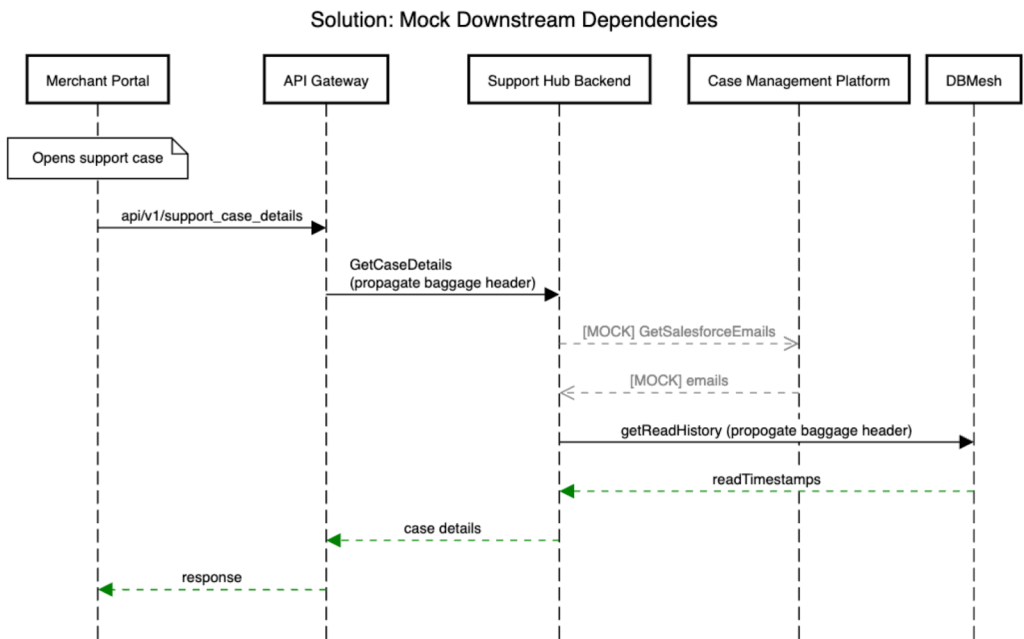
When testing the unread indicator feature with a baggage header injection, our downstream dependencies would reject the header, raising an exception. This occurred because the baggage header specified a tenant ID that is specific to the DBMesh service, meaning that the downstream dependencies could not recognize the header and therefore returned an error. To bypass this exception and test the unread indicator end-to-end, I mocked the downstream calls to allow the baggage header to be propagated from our backend-for-frontend layer to the database call. Figure 6 below illustrates the issue with some of the simplified logic.
Conclusion
Upon running Support Hub v1.5, we found a statistically significant 7% increase in unique actions within Support Hub, indicating that merchant engagement is amplified with these new functionalities. We also recorded an 11% decrease in repeat contacts — instances where merchants contact support multiple times for the same issue — which is not statistically significant but is directionally promising. Both statistics indicate that merchant issues are being resolved faster, freeing up time for support agents to address other high-priority cases.
Overall, these features will help centralize and streamline the support experience for merchants while ensuring seamless communication with DoorDash agents. Merchants now can view and reply to emails within Support Hub, giving them direct access to their support agent and providing them with a simple overview of all communications and support activity in a single location. Eventually, Support Hub will be able to bring in an AI agent to help resolve issues; Support Hub v1.5 is a step in this direction. These changes will help DoorDash reach its goal of providing merchants the highest-quality support experience, allowing them to resolve issues faster and more efficiently.
Automating financial variance analysis with DBSCAN clustering and LightGBM classification
By Anastasiya Masalava
At DoorDash, certifying accounting rule changes is a critical process for ensuring financial integrity. However, it has historically relied on manual variance analysis by engineers and accountants, which takes up to 2 weeks each month. During the summer internship, I worked on developing a machine learning solution to automate this analysis, to classify financial variances to significantly speed up the certification workflow.
The core challenge was how to handle thousands of "unknown" variances—discrepancies between our production and testing environments that don't fit into predefined categories. Analyzing these one by one is not scalable. To solve this, we needed to build an automated system to group similar variances and classify them.
Finding structure in the unknowns with clustering
The first step was to bring order to the thousands of unknown variances. The goal was to group them into meaningful buckets so that our accounting teams could analyze a few samples from a group rather than going through every single entry.
I started with an unsupervised clustering approach using the DBSCAN algorithm. My initial attempts involved clustering the data based on one or two dimensions, such as the variance amount and then adding temporal features like the day of the month. However, these models were not sufficient; they tended to group the vast majority of data points into a single large cluster, failing to provide the granular insights we needed.
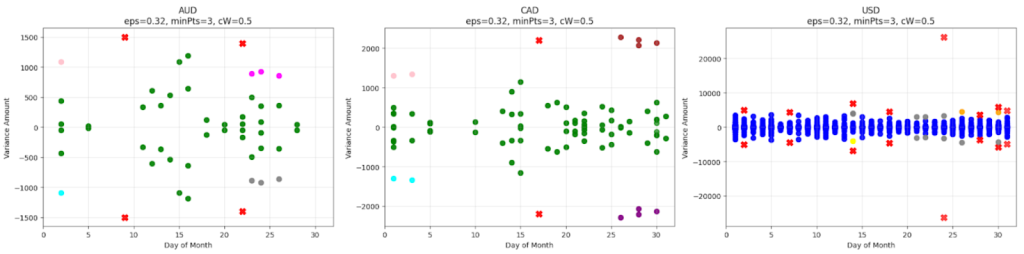
The breakthrough came from moving to a three-dimensional model. By adding currency as a third feature alongside variance amount and the day of the month, the model could create much more meaningful clusters. The data naturally separated into distinct layers based on currency (USD, CAD, AUD), which allowed the algorithm to identify smaller, contextually relevant groups within each currency, such as "high-variance Canadian dollar transactions occurring mid-month".
Classifying variances with a supervised model
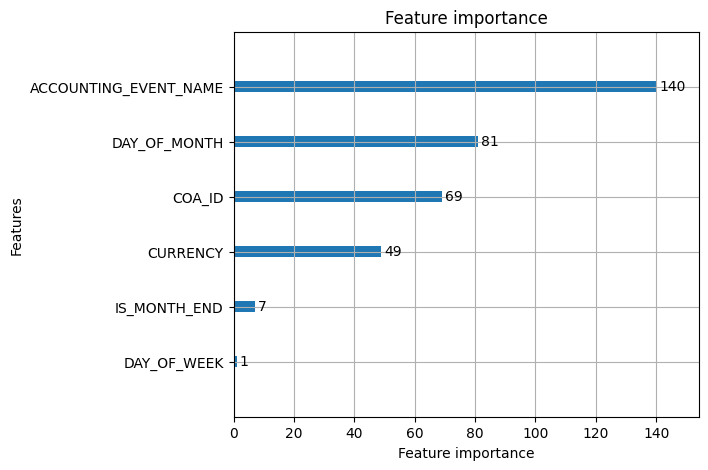
Once we could group unknown variances, the next step was to automatically classify new variances using our historical, labeled data. For this task, I chose a LightGBM classifier for its speed, efficiency, and ability to handle categorical features natively. I trained the model on a dataset where each variance had already been assigned a root_cause_category (e.g., "timing issue," "potential accounting rule bug") by the accounting team. The model learned to predict these categories based on a variety of engineered features, including the variance amount, booking time, currency, and other categorical data like the ‘accounting event name’.
Assessing performance
To validate the two models, I used a combination of qualitative and quantitative metrics.
- For the DBSCAN clustering model, the most important validation came from a qualitative review. The analysis confirmed that the variances grouped within each cluster were indeed of the same nature. For example, in one cluster of 216 journals, all journals were related to "order cart adjustments."
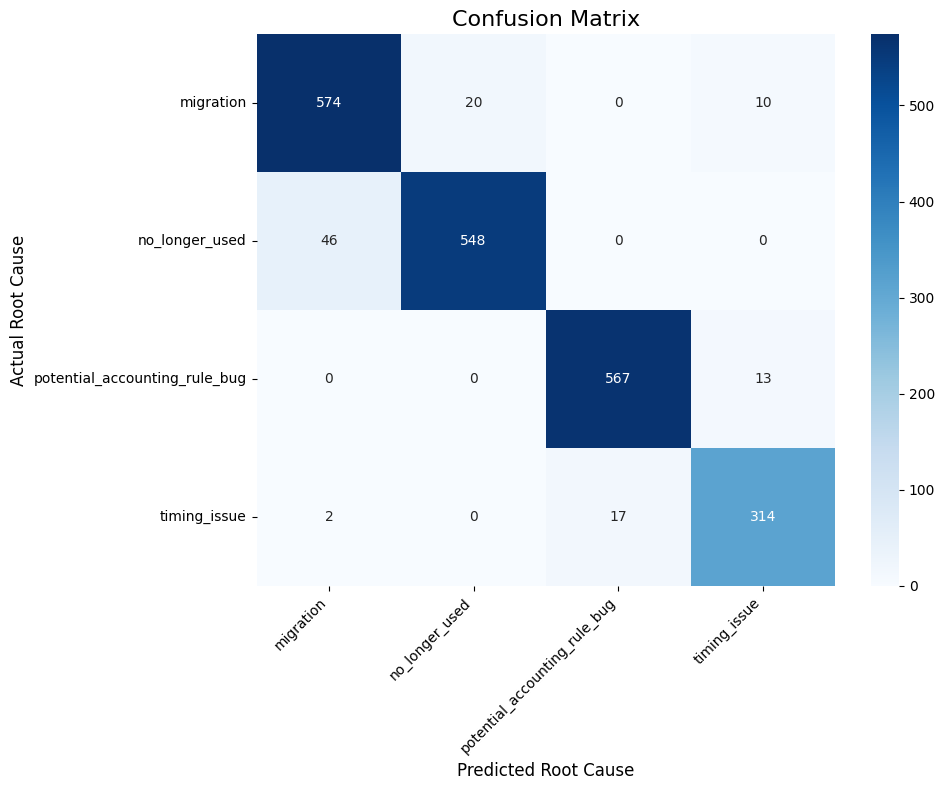
- The LightGBM classification model was evaluated quantitatively. It achieved a high validation accuracy of 94.88%. The model proved especially effective at identifying critical issues, such as potential_accounting_rule_bug.
The implementation of this dual machine learning model provides an automated and scalable solution for financial variance analysis. By clustering unknown variances, we enable our accounting teams to generalize the root cause for an entire group of journals by looking at just a few samples, significantly reducing their analysis time. The supervised classifier further automates this process by predicting the root cause for new variances in near real-time, allowing the team to focus their attention on the most critical issues. This automated workflow is a key component in our broader effort to accelerate financial system updates safely and reliably.
Scaling Creative Banner Automation with a Multi-Agent Workflow
By Tracy Shuhan Miao
Until recently, turning a merchant’s menu photos into polished marketing banners required days of back-and-forth that could not satisfy the scale or personalization that DoorDash’s marketplace demands. DoorDash hosts a vast library of merchant-provided images, but producing tailored, high-quality creatives often requires additional effort beyond simply fetching those images. But could we find a way to use existing merchant image assets already available on DoorDash, in particular to benefit small and medium-sized businesses?
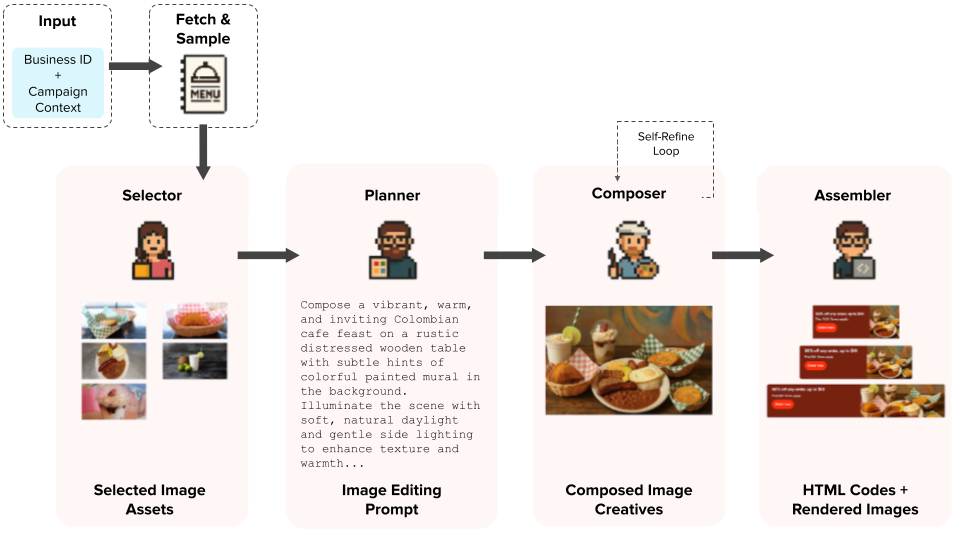
We developed a cooperating set of AI agents to address the bottleneck as shown in Figure 1. The agents can quickly convert existing merchant images into brand-compliant, design-system-ready creatives in minutes. Here we explain the core challenges we faced, how our multi-agent solution addresses them, and what happened when we stress-tested the agents on hundreds of businesses.
Defining the challenges
Among the key issues we needed to resolve were asset relevance, visual quality and brand integrity, throughput and cost, and reviewability:
- Asset relevance: A single restaurant’s menu can contain hundreds of images, many of which may be outdated or inconsistent with that brand's core offerings. Accurately selecting a small, campaign-appropriate subset — such as highlighting signature sandwiches rather than side items like cookies — is crucial for an effective automated pipeline.
- Visual quality and brand integrity: It’s challenging to turn sometimes marginal menu images into polished, high-quality composites tailored to a merchant’s branding. Standardized image-editing prompts can yield generic, inconsistent banners with problems like uneven lighting or rigid layouts. Diffusion-based image-generation models frequently hallucinate or blur brand text and logos. Our solution needed to generate custom prompts automatically that would reflect campaign goals and store identities while detecting and correcting brand-related defects.
- Throughput and cost: Large-scale marketing campaigns may require thousands of banner variants. We needed to create a fully parallelized, highly efficient workflow that could generate each one in seconds at a cost of only pennies per banner.
- Reviewability: Designers and ops teams must have editable outputs and granular checkpoints at each pipeline stage. This lets them easily tweak copy, colors, or call-to-actions without regenerating entire banner sets from scratch — a requirement traditional one-shot generation methods cannot fulfill.
Creating a multi-agent workflow
To tackle these challenges, we designed a fully concurrent pipeline of specialized AI agents that closely mimic a human design team's workflow, as shown in Figure 1. Each agent performs a focused task, sharing structured reasoning via schema-guided JavaScript object notation (JSON) prompts written to a shared memory bank. This parallelized, modular architecture enables seamless inter-agent communication, ensures coherent dependent reasoning, and allows the pipeline to be resumed efficiently from any checkpoint.
To address asset relevance, the pipeline intelligently filters and samples images using merchant-specific sales data and ratings to identify the most relevant and brand-aligned items. A selector agent works as a lightweight recommender to further narrow the options, reasoning explicitly about each merchant’s brand identity, campaign objectives, and asset availability to pick the best-fitting visuals.
For visual quality and brand integrity, a dedicated planner agent analyzes each image selected, flagging and annotating potential branding risks such as logos or embedded text. It then generates a detailed, tailored editing prompt that specifies the layout, background, tone, and visual style unique to the merchant and campaign. A composer agent executes this prompt, applying the planned layout, enforcing safe zones, and running a vision-language-based self-refinement loop. Within this loop, the agent automatically identifies problematic regions — such as distorted logos or blurred text — before generating corresponding masks. It then instructs the image generation model to selectively repair only those masked regions, preserving overall image integrity.
Finally, the assembler agent resolves any reviewability challenges by generating concise, campaign-specific copy and applying brand-compliant colors using a color analysis toolkit. It injects this content into DoorDash’s standardized HTML banner templates, ensuring outputs are fully editable and compliant.
Bringing it all together
We deployed our multi-agent pipeline as a scalable, callable gRPC endpoint with a distributed computing library. Additionally, we set up a model-context-protocol (MCP) server, equipped with tools to query the internal data warehouse for retrieving business and menu data, which then calls the gRPC endpoint to generate banners dynamically. Users can easily connect to the MCP server through cursor agents to create banner creatives for any business on demand.
Measuring impact
In a stress test involving 100 concurrent business workflows, our fully parallelized pipeline generated complete banner sets covering three platforms in a few seconds on average, at a minimal cost per set. To ensure visual quality and branding compliance, we subjected roughly a thousand of these banners to two rounds of external vendor quality assurance. Impressively, 98% of the banners passed the initial photo-quality review, while 79% passed the subsequent branding and artifact checks without modification. Additionally, we built and deployed an MCP server as internal tooling, allowing any DoorDash team, not just Ads Ops, to effortlessly request and generate banner creatives for any business on demand.
Conclusion
By breaking up the banner generation task into specialized, schema-guided agents that communicate through structured prompts and shared checkpoints, we transformed a manual process into a scalable, automated creative engine. The pipeline now produces high-quality, brand-compliant ads in minutes, laying the groundwork to integrate user-profile data for future personalization at scale.
Scaling Cluster Health Monitoring Across DoorDash
By Vinson Zheng
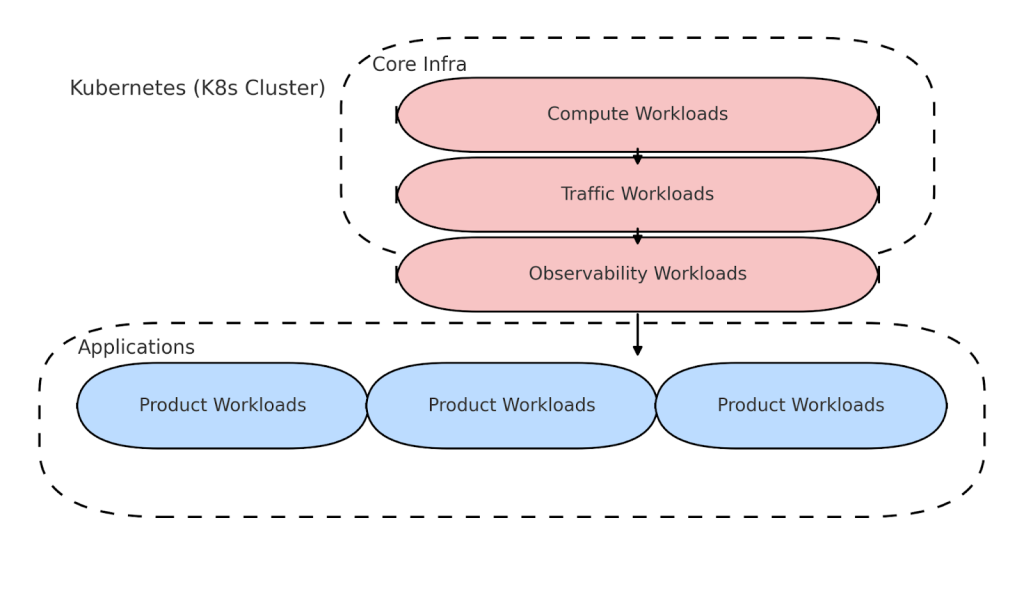
DoorDash celebrated a major milestone this summer: Our 10 billionth order. Behind the scenes, that scale is supported by more than 74 Kubernetes (K8s) clusters running our core infrastructure.
As our compute platform has grown, so has the complexity of monitoring it. Each cluster contains critical components — including traffic routers, secure secrets management via Vault, and autoscaling components — all of which must be healthy before a cluster can be mounted as operational.
Until recently, verifying cluster health required engineers to spend hours jumping between tools like ArgoCD, SSH-ing into clusters to run kubectl commands, and manually checking Chronosphere dashboards. The process was fragmented, reactive, and slow, creating operational overhead and slowing our ability to safely roll out changes at scale.
The challenge: Monitoring at scale
As DoorDash’s compute platform scaled, we faced three core challenges:
- Unreliable health signals: After cluster provisioning or updates, engineers couldn't easily verify if key infrastructure components were healthy and ready to serve. This led to ambiguous cluster states and increased rollout risk, an issue that would only get worse as we scaled.
- Fragmented, manual monitoring: Health checks required a variety of tools (ArgoCD, Chronosphere, kubectl) and deep tribal knowledge. Engineers spent significant time manually validating clusters, slowing platform velocity, and draining bandwidth that could be used for innovation and development.
- No systemic validation or automation: Without a standardized way to monitor infrastructure dependencies or emit cluster-wide health signals, issues went undetected until they caused real problems, creating a reactive, firefighting culture and eroding platform reliability.
Our solution: A cluster health framework
We set out to build a unified, declarative monitoring system that is:
- Easy to use and extend
- Modular and Kubernetes-native
- Robust enough to handle more than 74 clusters and counting.
The end result is the cluster health framework, a Kubernetes operator that uses custom resource definitions, or CRDs, to define, execute, and monitor health checks across clusters.
It gives stakeholders a clear answer to their key question: Is this cluster healthy or not?
The framework transforms what was once a reactive and time-consuming process into a proactive, efficient system, paving the way for eventually enabling automated progressive rollouts and centralized monitoring.
Architecture overview
Figure 2 provides a 10,000-foot view of the framework:
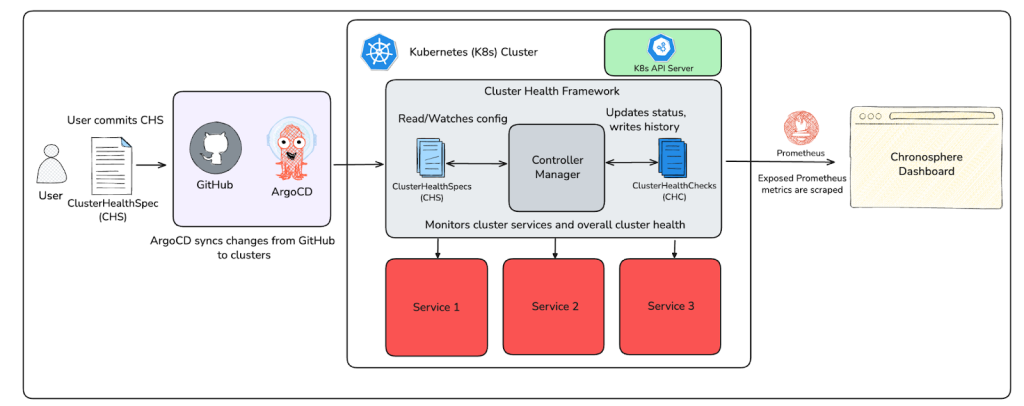
- Define checks: Infrastructure engineers write a ClusterHealthSpec (CHS) CRD listing health checks and commit it to GitHub.
- Sync to clusters: The spec is deployed using ArgoCD to clusters running the framework.
- Validation and execution: Admission webhooks validate the spec. A controller runs checks and generates a ClusterHealthCheck (CHC) for each that contains the results of the run.
- Emit metrics: Prometheus metrics are emitted and visualized in Chronosphere dashboards for alerting.
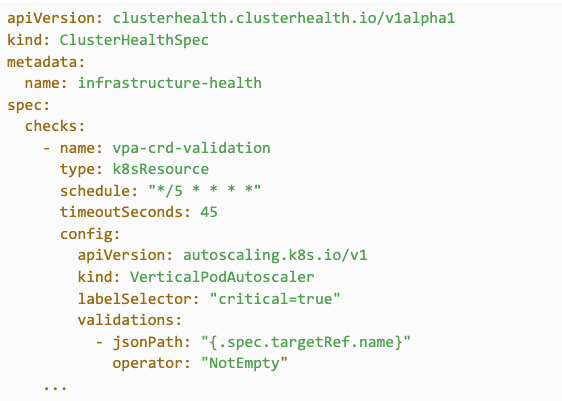
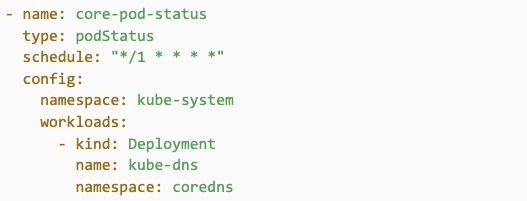
Custom resource definitions (CRDs)
As noted above, the entire workflow starts with a CHS, a declarative resource that defines the health checks for a cluster. Figure 3 shows an example of this:
After the CHS runs a health check, the controller generates a CHC resource to store its results. This CHC is updated on each subsequent run, giving engineers visibility into recent outcomes and trends. Figure 4 shows an example of this:
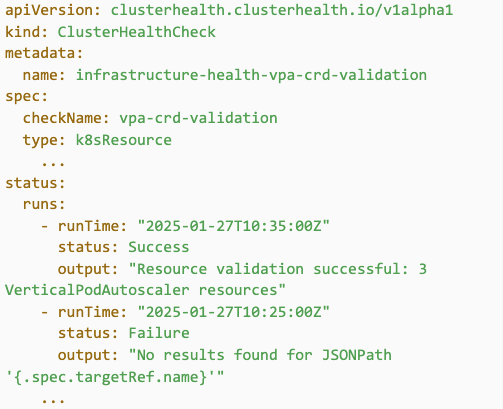
We keep the results of the previous five runs, offering visibility into flakiness and historical failures.
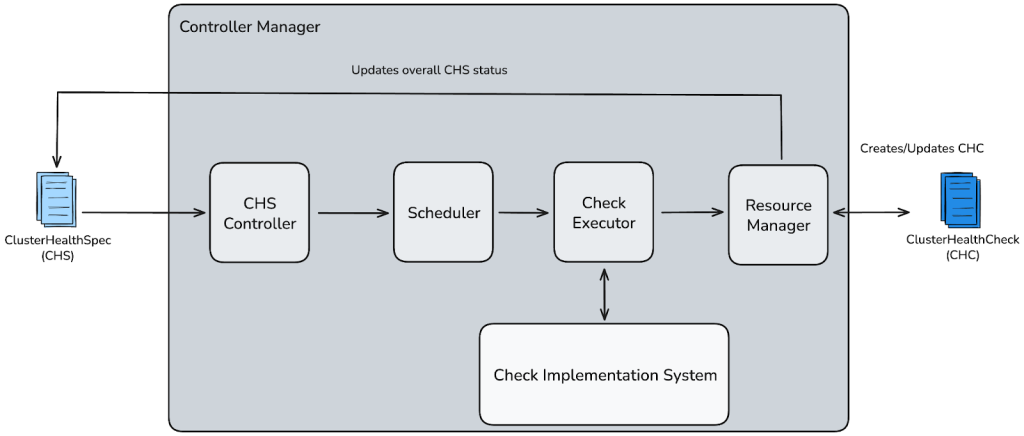
Controller manager
As shown in Figure 5, the controller manager sits at the heart of the cluster health framework. It is a long-running process built with Kubebuilder that drives the full lifecycle of all health checks. It continuously watches CHS resources and processes them on a fixed cadence, following the standard reconciliation loop pattern used by Kubernetes controllers.
Admission webhooks
To prevent misconfigured checks from reaching production, the controller framework includes admission webhooks that validate every submitted CHS.
Resource management and cleanup
Beyond executing health checks, the controller also manages the full lifecycle of health resources to ensure that the system remains clean, consistent, and low-maintenance.
- When a CHS is deleted, all associated CHC resources are automatically cleaned up.
- If a check is modified or modified within a CHS, the controller prunes obsolete CHCs to prevent stale data.
- The controller manages its state across restarts gracefully. It prevents orphaned checks and ensures that resources aren’t leaked.
These cleanup capabilities help keep operational overhead low, even at a massive scale.
Health check types: Building blocks of cluster monitoring
The controller manager is built to support diverse health checks through a shared Run() interface. Each check type implements this interface and plugs it seamlessly into the reconciliation loop. Figure 6 below shows how the internal components fit together:
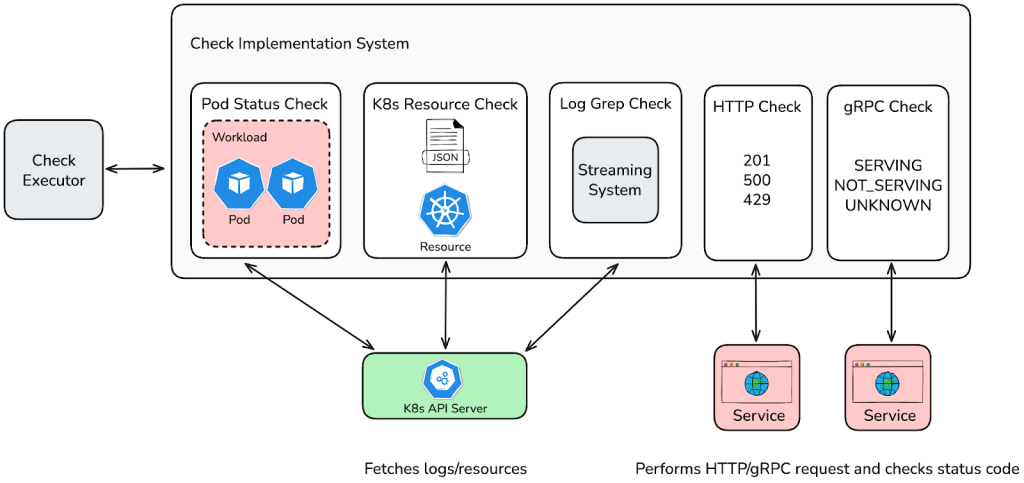
Now let's take a look at the five core health check types, plus the overall status check:
Pod status: Ensures the existence, running state, and ready condition of Pods. How it works, as shown in Figure 7:
- Queries the Kubernetes API for Pods in specified namespaces by workloads or labels.
- Verifies Pod existence, running phase, and container readiness.
- Configurable grace periods help avoid premature alerts during Pod creation.
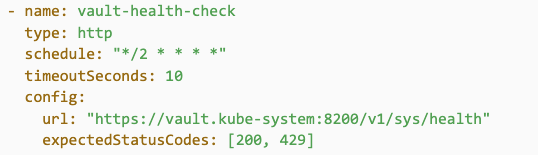
HTTP: Validates endpoint health via HTTP requests. Sends HTTP requests and checks the response against expected status codes.
How it works, as shown in Figure 8:
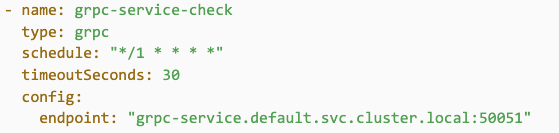
- gRPC: Validates services that expose gRPC health endpoints. Uses the standard gRPC Health Checking Protocol to query services for their status. How it works, as shown in Figure 9:
- Log Grep: Detects critical errors from logs in real-time. Streams logs from targeted deployment workloads and scans for user-defined error patterns. Marks a check as failed if the number of matching log lines exceeds a defined threshold. Implemented as shown in Figure 10:
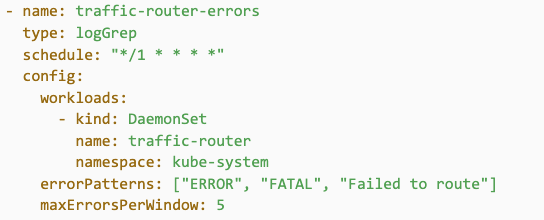
Robust resource management for log streams
Continuously streaming logs via goroutines introduced several lifecycle edge cases we needed to proactively address. Without proper cleanup, these streamers could leak resources, produce duplicate logs, or silently fail. Here's how we dealt with these edge cases:
- Individual check deletion: A pruning function identifies log streamers no longer associated with any active check. These unused streamers are cancelled automatically to free up resources.
- Controller shutdown and restart: We leveraged the controller-runtime's context cancellation mechanism. On shutdown or restart, all streaming contexts are gracefully terminated and no orphaned goroutines are left behind.
- Loss of leadership, or leader election: Streaming logic is explicitly tied to controller leadership status. If a controller instance loses leadership, all associated streaming contexts are cancelled, which avoids conflicts or duplicated log processing across replicas.
This comprehensive approach ensures our log grep checks remain efficient, reliable, and leak-free even as our infrastructure continues to scale.
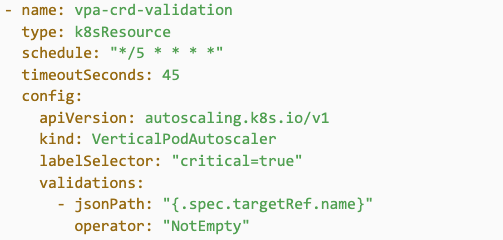
K8s resource: Ensures the presence and configuration of Kubernetes resources, leveraging the API server as the interface to cluster state stored in etcd. As shown in Figure 11, it works by querying the Kubernetes API either by a specific resource or by resource type with an optional configuration to filter by label selectors and/or namespaces. This validates field values using JSONPath and a set of configurable operators such as Equals, NotEmpty, RegexMatch, ListContains, and more.
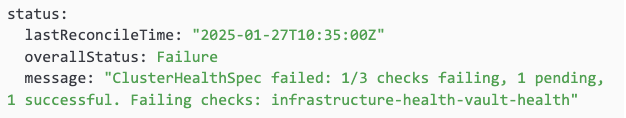
Overall Status: Aggregates the results of all health checks in a CHS to produce a single cluster health signal. As shown in Figure 12, it works by evaluating all associated CHC results and emitting an overall status as success, failure, or pending:
- Failure: At least one check failed.
- Pending: No checks have been completed.
- Success: At least one check succeeded and there are no failures.
Monitoring and observability
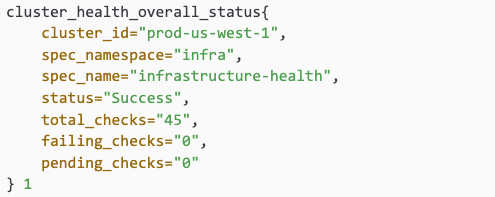
- Prometheus metrics: Each check result, including the aggregated overall status check, is emitted as a Prometheus metric, as shown in Figure 13:
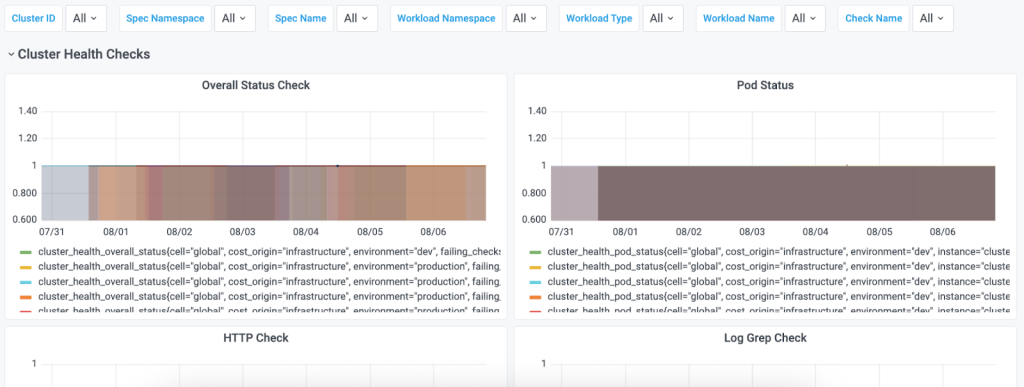
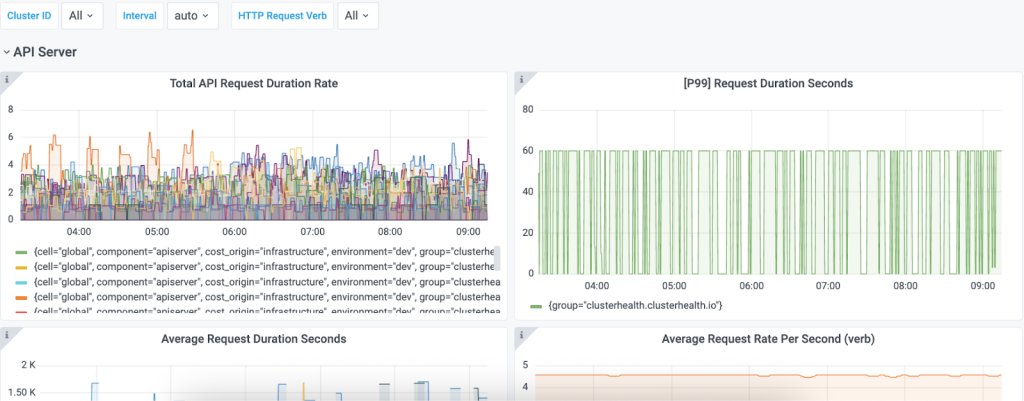
Chronosphere dashboards
To enhance alerting and incident response, we leverage Chronosphere to visualize these metrics in intuitive dashboards. As shown in Figures 14 and 15, engineers can quickly:
- Assess health across clusters at a glance.
- Investigate specific failing checks or trends.
- Configure proactive alerts based on thresholds.
Transforming platform operations
Since deploying the cluster health framework across our clusters, we have experienced numerous improvements, including:
1. Faster, safer cluster operations
Before: Engineers manually verified readiness, slowing down bootstrapping/syncing and introducing risk.
Now: Readiness checks are automated; changes are accelerated by real-time health signals emitted by the framework.
Impact:
- Significantly reduced cluster provisioning time
- Safer, faster, and more reliable deployments
2. Unified visibility and early detection
Before: Health signals were fragmented across tools and teams, making it hard to catch issues early or troubleshoot effectively.
Now: Chronosphere dashboards surface clear Prometheus metrics for both individual checks and overall cluster status.
Impact:
- Single-pane-of-glass view across all clusters
- Faster debugging with pinpointed alerts
- Lower mean-time-to-repair through early detection and issue isolation
- Proactive detection of misconfigurations before they impact production
This shift has helped engineers move faster, build with more confidence, and trust the platform’s health at every stage from bootstrap to rollout.
Looking forward
DoorDash plans to expand the framework in several ways by adding:
- Pod exec health checks:
- Chaos engineering integration: Run health checks under simulated failure scenarios
- Concurrent check running: Parallelizing running checks within a ClusterHealthSpec
- Automated progressive rollouts: Automating our cluster sync/bootstrapping process using our overall status cluster health signal
Conclusion
Building the cluster health framework gave me first-hand experience in developing infrastructure that can scale with confidence. What was once manual and fragmented is now automated and unified across more than 74 Kubernetes clusters.
By making health checks declarative and visible, we've given engineers the tools and confidence to move faster without sacrificing safety. This shift not only reduces operational overhead, but also accelerates how we build, ship, and scale at DoorDash.
I'm excited for the framework to continue expanding in the future, especially as it becomes more deeply integrated into our rollout pipelines and platform workflows.
Special thanks to my mentor Sindhu Rayavaram, my manager Erin Commarato, and the entire DoorDash Compute Infrastructure team–Alec Rabold, Bojan Zelic, Bronson Mirafuentes, Lei Xian, Nishanth Reddy Pinnapareddy, Shannon Li, and Stephen Joel for your support and feedback. This project wouldn’t have been possible without your guidance.
From Runbooks to Self-Service: Building DoorDash’s Data Compute Service
By Chase Geyer
Provisioning infrastructure can be one of the biggest slowdowns in a developer’s workflow across the tech industry. When the process is manual, it often relies on scattered documentation, institutional knowledge, and one-off execution by whoever happens to be on-call.
At DoorDash, cluster provisioning in our data processing platform followed exactly this pattern. A request would start in a chat thread, move into a round of clarifying questions, then be passed to an on-call engineer, who might have no prior experience with the platform but nevertheless would have to track down a runbook, interpret its steps, and execute these manually. This process was both slow and prone to risk. Misinterpret a runbook step, and the next on-call shift could inherit a broken setup. Both sides felt the impact: Requesters waited longer to get resources, and on-call engineers were pulled away from their core responsibilities.
When I joined DoorDash’s Data Control team in May 2025, my task sounded straightforward: Make it easier for engineers to create long-lasting data resources. But “easier” in this case meant overhauling an entire provisioning workflow that was deeply ingrained in daily operations.
What began as a series of manual steps scattered across teams is now the Data Compute Service — a production-ready Golang microservice, backed by infrastructure automation and surfaced through a polished DevConsole plugin. Today, instead of waiting for an on-call engineer to interpret a runbook, developers can self-serve clusters in minutes, confident that cost, compliance, and security are under control.
Setting the vision
Shadowing the current process for two weeks, I saw that provisioning a compute cluster involved the following steps:
- A user posts a request in a Slack channel.
- An on-call engineer tries to gather the right details.
- That engineer locates a runbook, which sometimes is outdated or unclear.
- The engineer then manually provisions the resource, hoping not to miss a step.
The pain points were clear:
- Lengthy back-and-forth between requesters and provisioners,
- Context-switching for on-call engineers, who had to learn on the fly, and
- Inconsistent execution because of runbook complexity.
To replace this, I proposed creating a self-serve platform to guide users through provisioning with intelligent defaults and enforce compliance tagging and budget awareness automatically. The guiding vision would be to create a platform that could be extended to support other resource types.
Designing and building
Prototyping began with an end-to-end lifecycle map of a compute cluster, including understanding how S3 roles, the Glue catalog, and the Hive metastore fit together. I created early user interface (UI) prototypes in Figma, gathering feedback from my team to ensure the interface would be intuitive for both first-time and power users.
Architecture pivot
My initial prototype tried to embed the provisioning logic directly within DevConsole, our internal service. But as requirements grew, it became clear that this approach wasn’t scalable. After consulting with my mentor and manager, I proposed a dedicated Golang microservice with application programming interfaces for remote procedure calls (gRPC APIs). This service would handle business logic, while DevConsole would focus on user interaction.
Service development
Over the next few weeks, I extracted cluster creation logic from manual scripts into testable Go code, defined gRPC interfaces, and implemented strict validation rules. We then developed backend data models in CRDB and integrated with the storage platform. Throughout the process, I worked with the Asset Service and Infra Service teams to ensure proper tagging, compliance, and security.
Frontend integration
Once the backend was stable, I built a backend-for-frontend in DevConsole to communicate with the service. On the frontend, I implemented a React interface with:
- Intelligent defaults based on team best practices,
- Real-time cost estimation to align with finance requirements, and
- Progressive configuration options to provide flexibility for advanced users to do fine-tuning without overwhelming new users.
By the end of Week 10, the service was fully integrated and we began end-to-end testing.
Rolling out and looking forward
In the final two weeks, I gathered feedback from ML engineers, reliability teams, and other key stakeholders. Their input helped fine-tune defaults, clarify UI flows, and ensure robust error handling.
When we launched into the foundations data organization, the difference was immediate: Provisioning time dropped from hours, or even days, to minutes. On-call engineers ceased being a bottleneck and compliance occurred automatically in the background.
Future potential
The Data Compute Service was built with scalability in mind. Adding a new resource type is straightforward and batch provisioning is on the roadmap. We’re also considering user-generated templates to allow teams to share proven configurations across the company.
Conclusion
Now part of DoorDash’s DevConsole, the Data Compute Service enables engineers to create compliant, cost-aware compute clusters in minutes with no runbooks, no handoffs, and no waiting. It’s already reducing operational overhead and speeding up development cycles.
For me, the project was a masterclass in building production-ready services: Navigating cross-team dependencies, balancing speed with maintainability, and designing for long-term scalability. And it’s just getting started. This platform is ready to grow into a cornerstone of DoorDash’s self-service infrastructure.
Acknowledgements
Thank you to my mentor Ting Xiong, my manager Mike Davis, and the Data Control, Data Management, Reliability Platform, and Asset Service teams for their guidance, collaboration, and patience as I navigated the many moving parts of this project.


