Skip to content

This post covers the client and platform boundaries behind user experience and interactions with Ask DoorDash: how we moved from hackathon carousels to that model, how one artifact serves three readers, and how context and state stay consistent as consumers move through DoorDash. It follows Building DoorDash Assistant: An Engineering Overview and our deep dives Building Ask DoorDash (Part 2): Intelligence, Building Ask DoorDash (Part 3): Evaluation, and Building Ask DoorDash (Part 4): A Platform for Building and Evolving Agents.


Ask DoorDash turns requests like “build me a $60 dinner for 10 people”, “help me make chicken tacos”, and “snacks for the week” into editable shopping lists. It produces a list with shoppable products, prices, photos, quantity controls, and simple buttons for swapping any item, and checking out. For restaurant requests, stores and dishes are returned that connect into the native shopping flow. Both functionalities run on the same client and platform machinery. This post is focused on the grocery use case, as it puts the most pressure on all of the major complexities of creating an intuitive interface for agent-driven shopping. Grocery lists commonly hold ten or twenty items, go through several rounds of revision, and must easily deal with consumer constraints like budgeting and dietary restrictions.

User sessions from July 2026 showed that in grocery sessions where a shopping list was rendered, consumers averaged close to two UI interactions each. Roughly a third of those sessions went on to apply the list to a cart. The assistant takes the broad intent of consumers and boils it down. The output is native components, which allow for granular refinement by consumers. Simple edits update an authoritative artifact immediately, while changes that require reasoning start a new agent turn.

In order to produce an effective collaborative consumer/agent shopping experience, shopping agents need to integrate with an interactive surface grounded in live commerce data and the consumer’s current app context. When a consumer is shopping in an app, they expect to see at a glance real items they can purchase. Text can describe that environment, but image-based, interactive components let consumers actually traverse it. Context matters too. Consumers opening DoorDash arrive with different expectations than they bring to a general-purpose chat app. They shop by browsing, moving between stores and pages rather than describing what they want. Meeting them where they are is an essential piece of the puzzle.

Big things have small beginnings

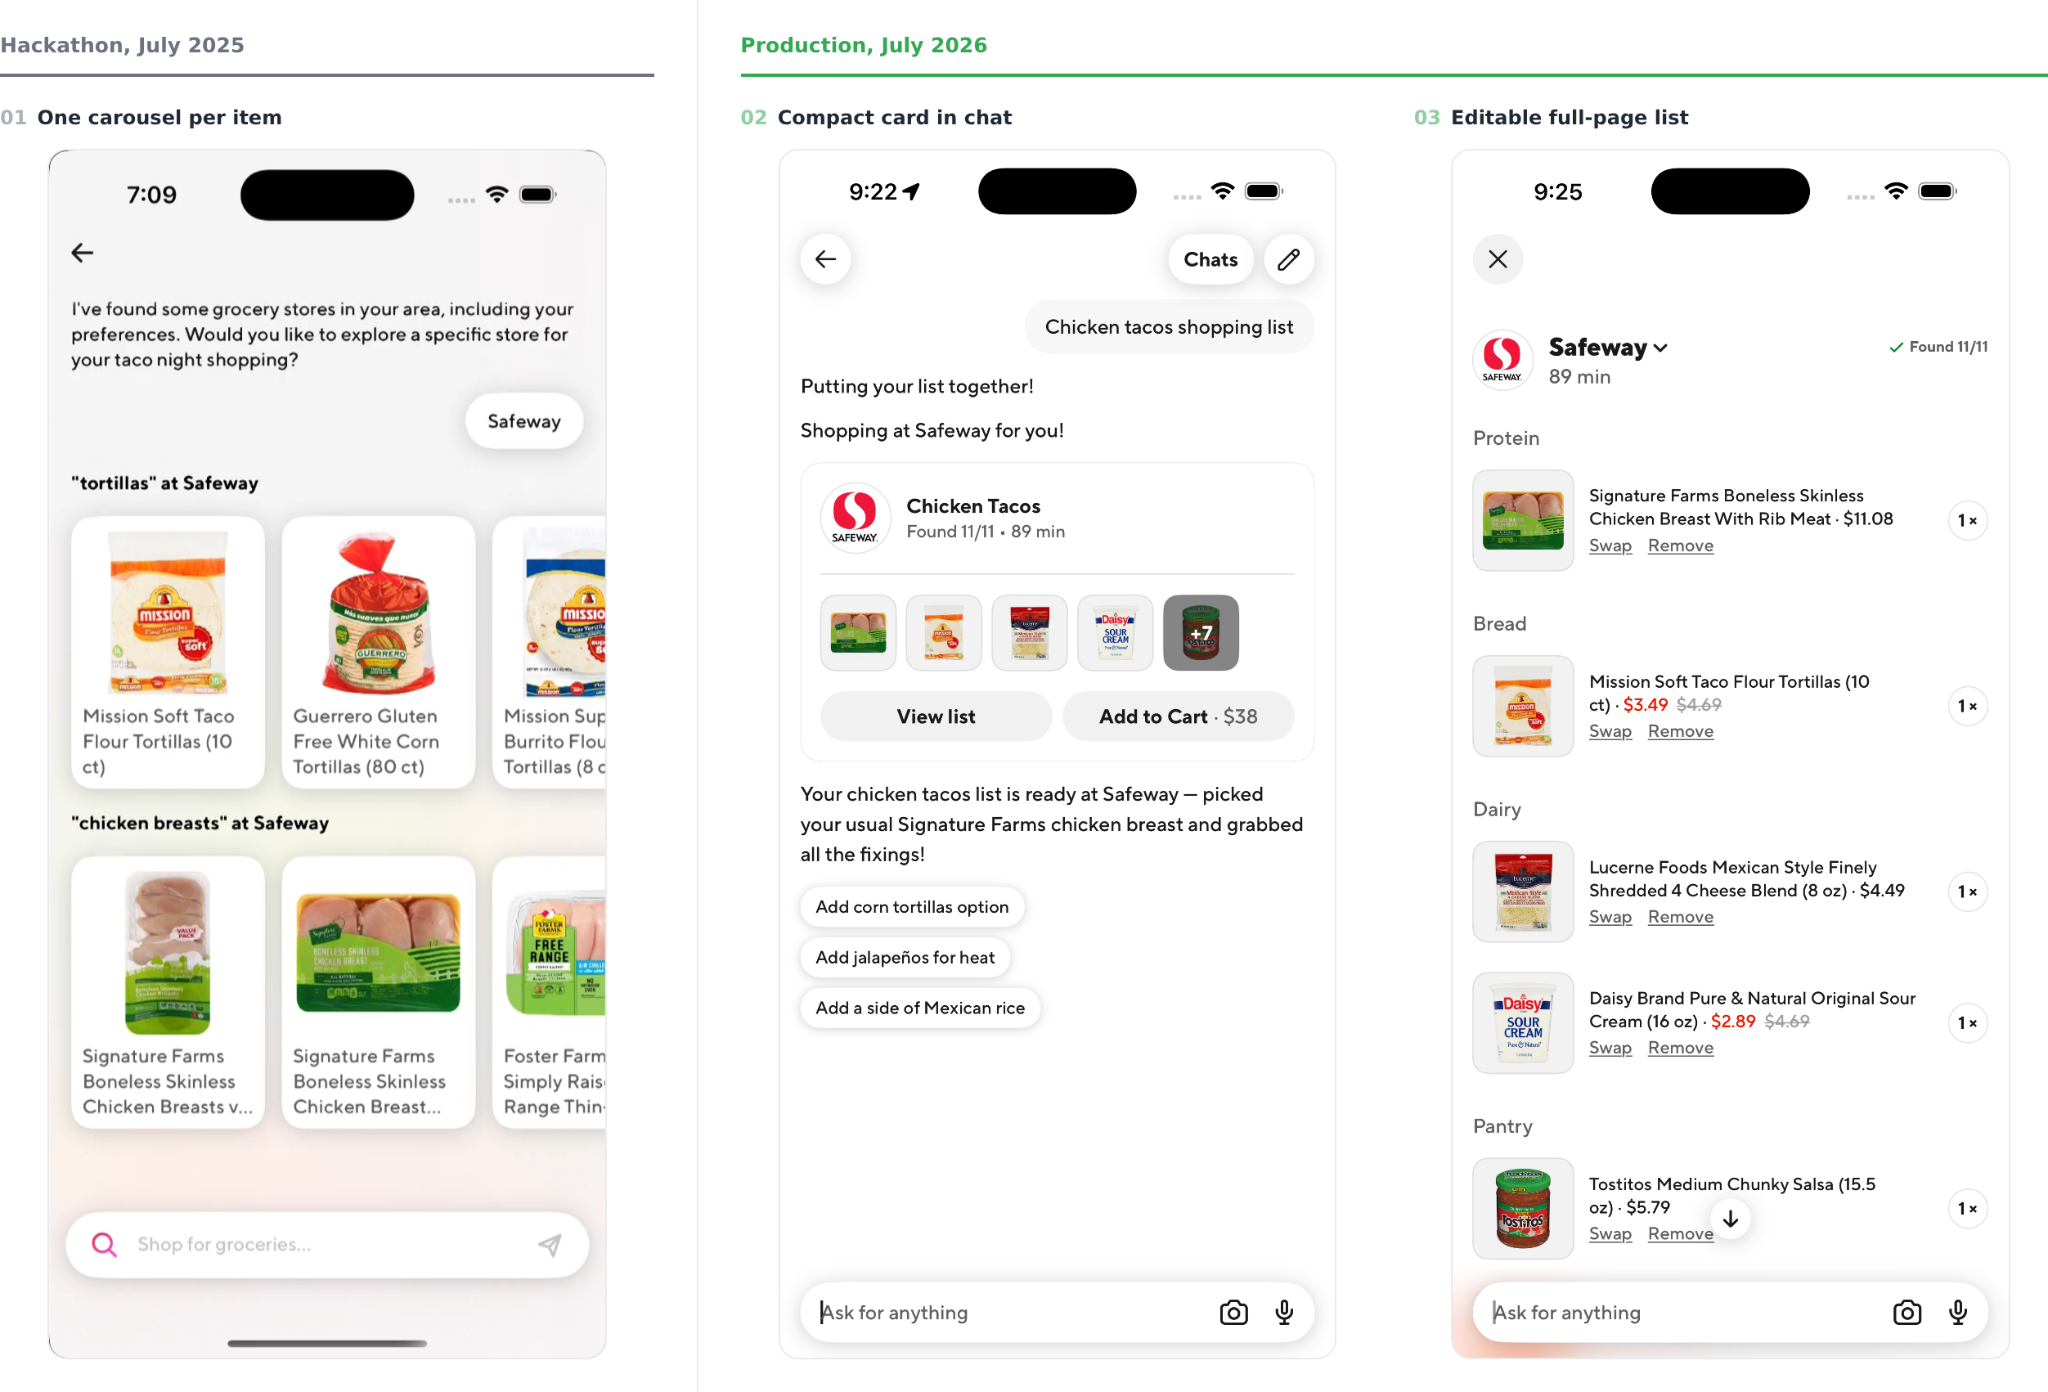
The DoorDash grocery assistant began as a hackathon project. We knew from the start that integrating existing DoorDash components would be a key piece of whatever we built. The earliest versions leaned heavily on carousels: first a list of nearby store candidates, then a carousel of search results for each item the agent was looking for. They were rendered inline, each with its search term attached. The result was essentially a chat transcript with commerce results pasted into it.

Functionally, it was close to what we ship today. As an experience it was rougher, and the specifics are worth walking through.

Having found a set of stores, the assistant asked which one to explore and waited for the answer to be typed. Each carousel represented a single item the consumer needed, and picking an option from it added that item to the cart. Every one arrived with its candidates spread out at full width and the choice still open. So building a week of groceries meant working down the stack one selection at a time, with no way to accept a set of items all at once.

Underneath all of it was one failure running in both directions: the interface was built primarily to present the assistant’s work. Every carousel was headed by the query that produced it and candidates sat in the order they were retrieved. Search terms and raw result sets are an agent’s working material. Presenting the results directly is the interface equivalent of printing a stack trace. The assistant deferred just as readily to the interface, working one item at a time because a stack of per-item carousels was what the screen could show. Each had been designed around the other’s limitations rather than around the consumer.

The lesson was not that reusing existing components was wrong; the familiarity they carry is exactly why the assistant feels like DoorDash. We had simply built the wrong container for them. The container is what decides the order they appear in, what they sit next to, and what a consumer can do with them. Above all else, a consumer needs a shopping surface rather than a conversation interface. We had built a conversation interface that happened to contain shopping components. Component reuse gave us the vocabulary. Composing it into a surface was the harder part.

What did survive the hackathon was the foundation: the same streaming infrastructure it established is what the experience runs on today. Meanwhile, the decoding layer that turned tool results into UI did not last. The assistant no longer surfaces tool results at all. Instead, we invested time to build out an artifact architecture that separates out consumer requirements from storage and agent requirements. In other words: we stopped decoding the agent’s working material for display and started to build around the needs of the different components and consumers of the system.

Figure 1: The same grocery request, a year apart. The hackathon build showed a carousel per item, each headed by the query that produced it; selection was left to the consumer. Today, the assistant returns each list as a card in the conversation, with top items already picked.

One artifact, three lenses

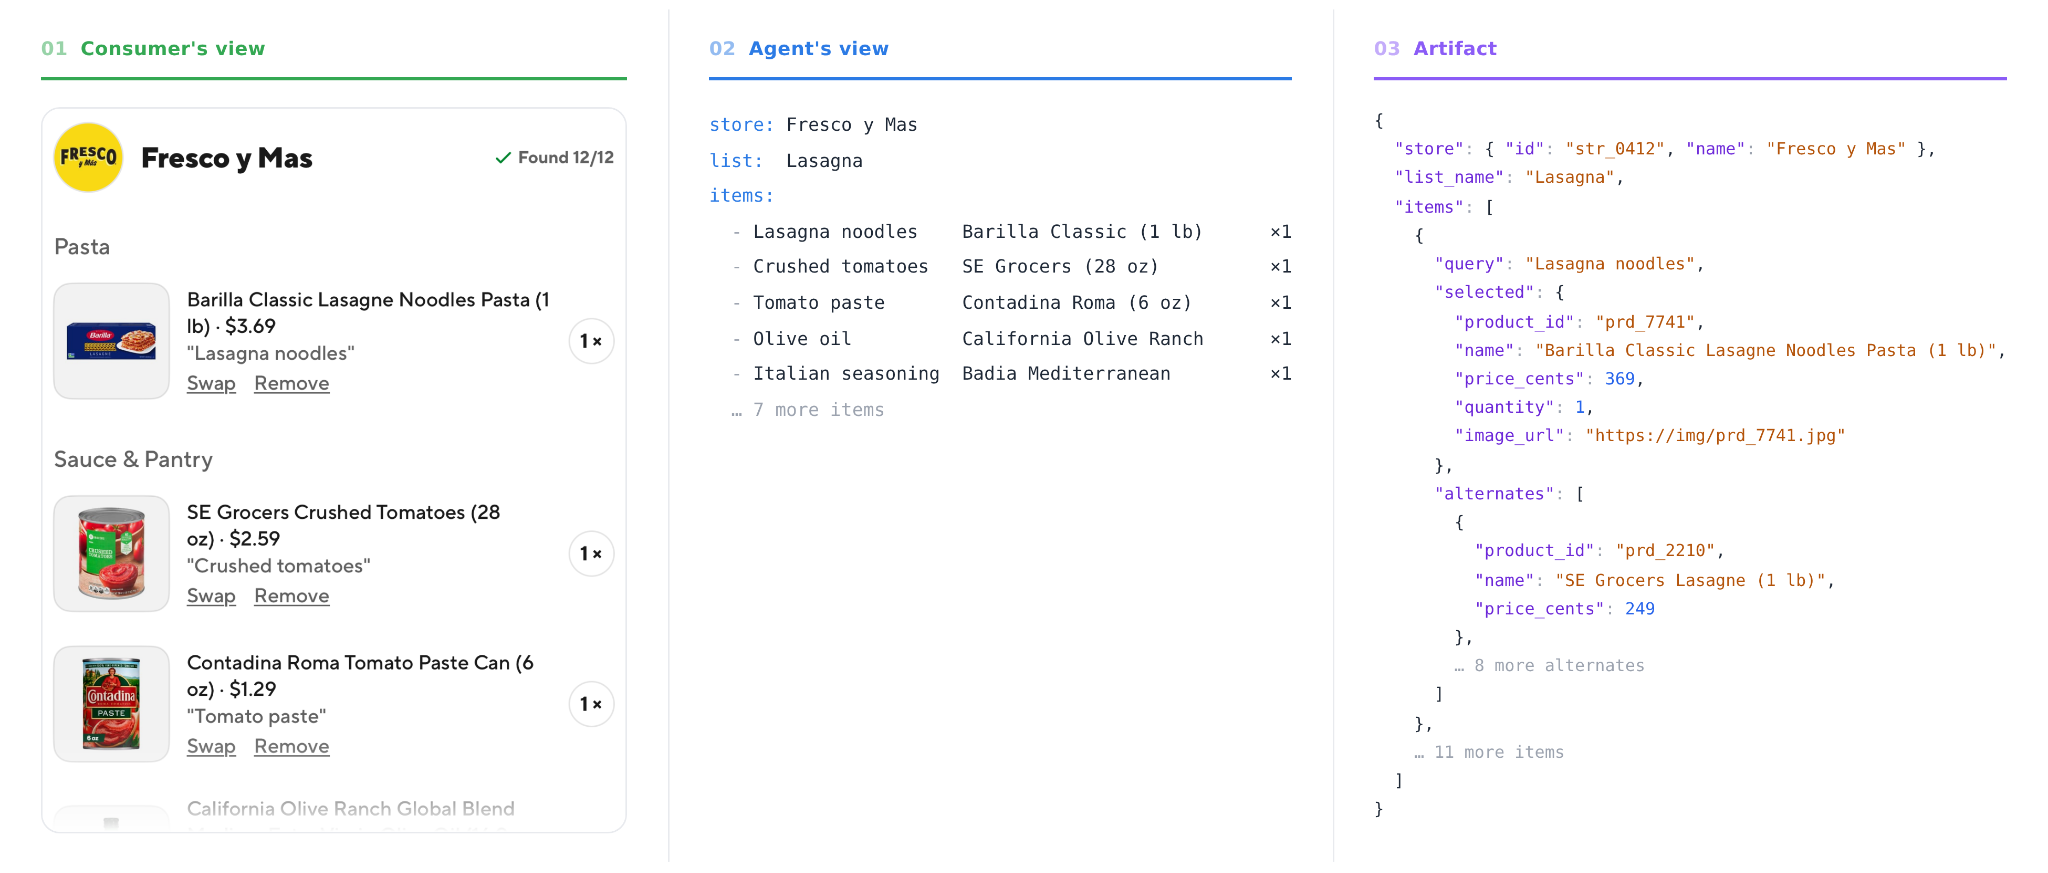
A shopping list has three readers: the service that stores it, the agent that revises it, and the person shopping. Each one needs to see something different. Keeping them separate is what lets a consumer’s edit appear immediately and stay authoritative without costing another model turn.

The stored form is the system of record: a JSON blob held as an artifact in Managed Agent Services, described in the platform post. It has to be complete, and it is the only authoritative copy.

The agent does not read that blob directly. An interactive shopping list carries far more detail than a model needs for most follow-ups. Repeating every product name, price, quantity, substitution, and piece of display metadata on every turn would compete with what the consumer actually asked for. So when an agent emits a widget, what stays in conversation context is a compact summary: the store, and what the list contains. When a turn needs exact state, the agent reads the artifact and gets back a reduced view with the display metadata stripped out. That view is unambiguous and small enough to reason over cheaply. A median list persists as 40 to 60 KB of JSON. What stays in the conversation context is a single line of about 240 characters, roughly 250 times smaller.

What the consumer sees is different again, and it takes more than one form. In the conversation the list renders as a compact widget: the store, the name of the list, the ETA, a few item photos, and an “Add to Cart” button carrying the estimated total. That is enough to judge the list at a glance without leaving the chat. A “View List” button opens the full-page view, which presents the complete list and everything needed to work through it in detail. Both views are built to be grasped immediately and acted on directly.

One detail shows how far these views diverge. When the agent chooses a product for an item on the list, it keeps the other products that matched the same search, and the consumer can swap between them with a tap. It keeps ten candidates per item, and 99.7% of items have enough matches to fill that out, so nearly every line in the consumer’s view has one selection and nine alternates behind it. The consumer’s view carries every one of those alternates. The agent’s view carries none of them, because choosing between them is the consumer’s job (unless the assistant is explicitly asked to).

Figure 2: One list, three lenses. The consumer sees prices, photos, and a swap behind every line. The agent sees only the store and what the list contains. The artifact holds all of it, including nine alternates for the lasagna noodles alone.

Staying grounded

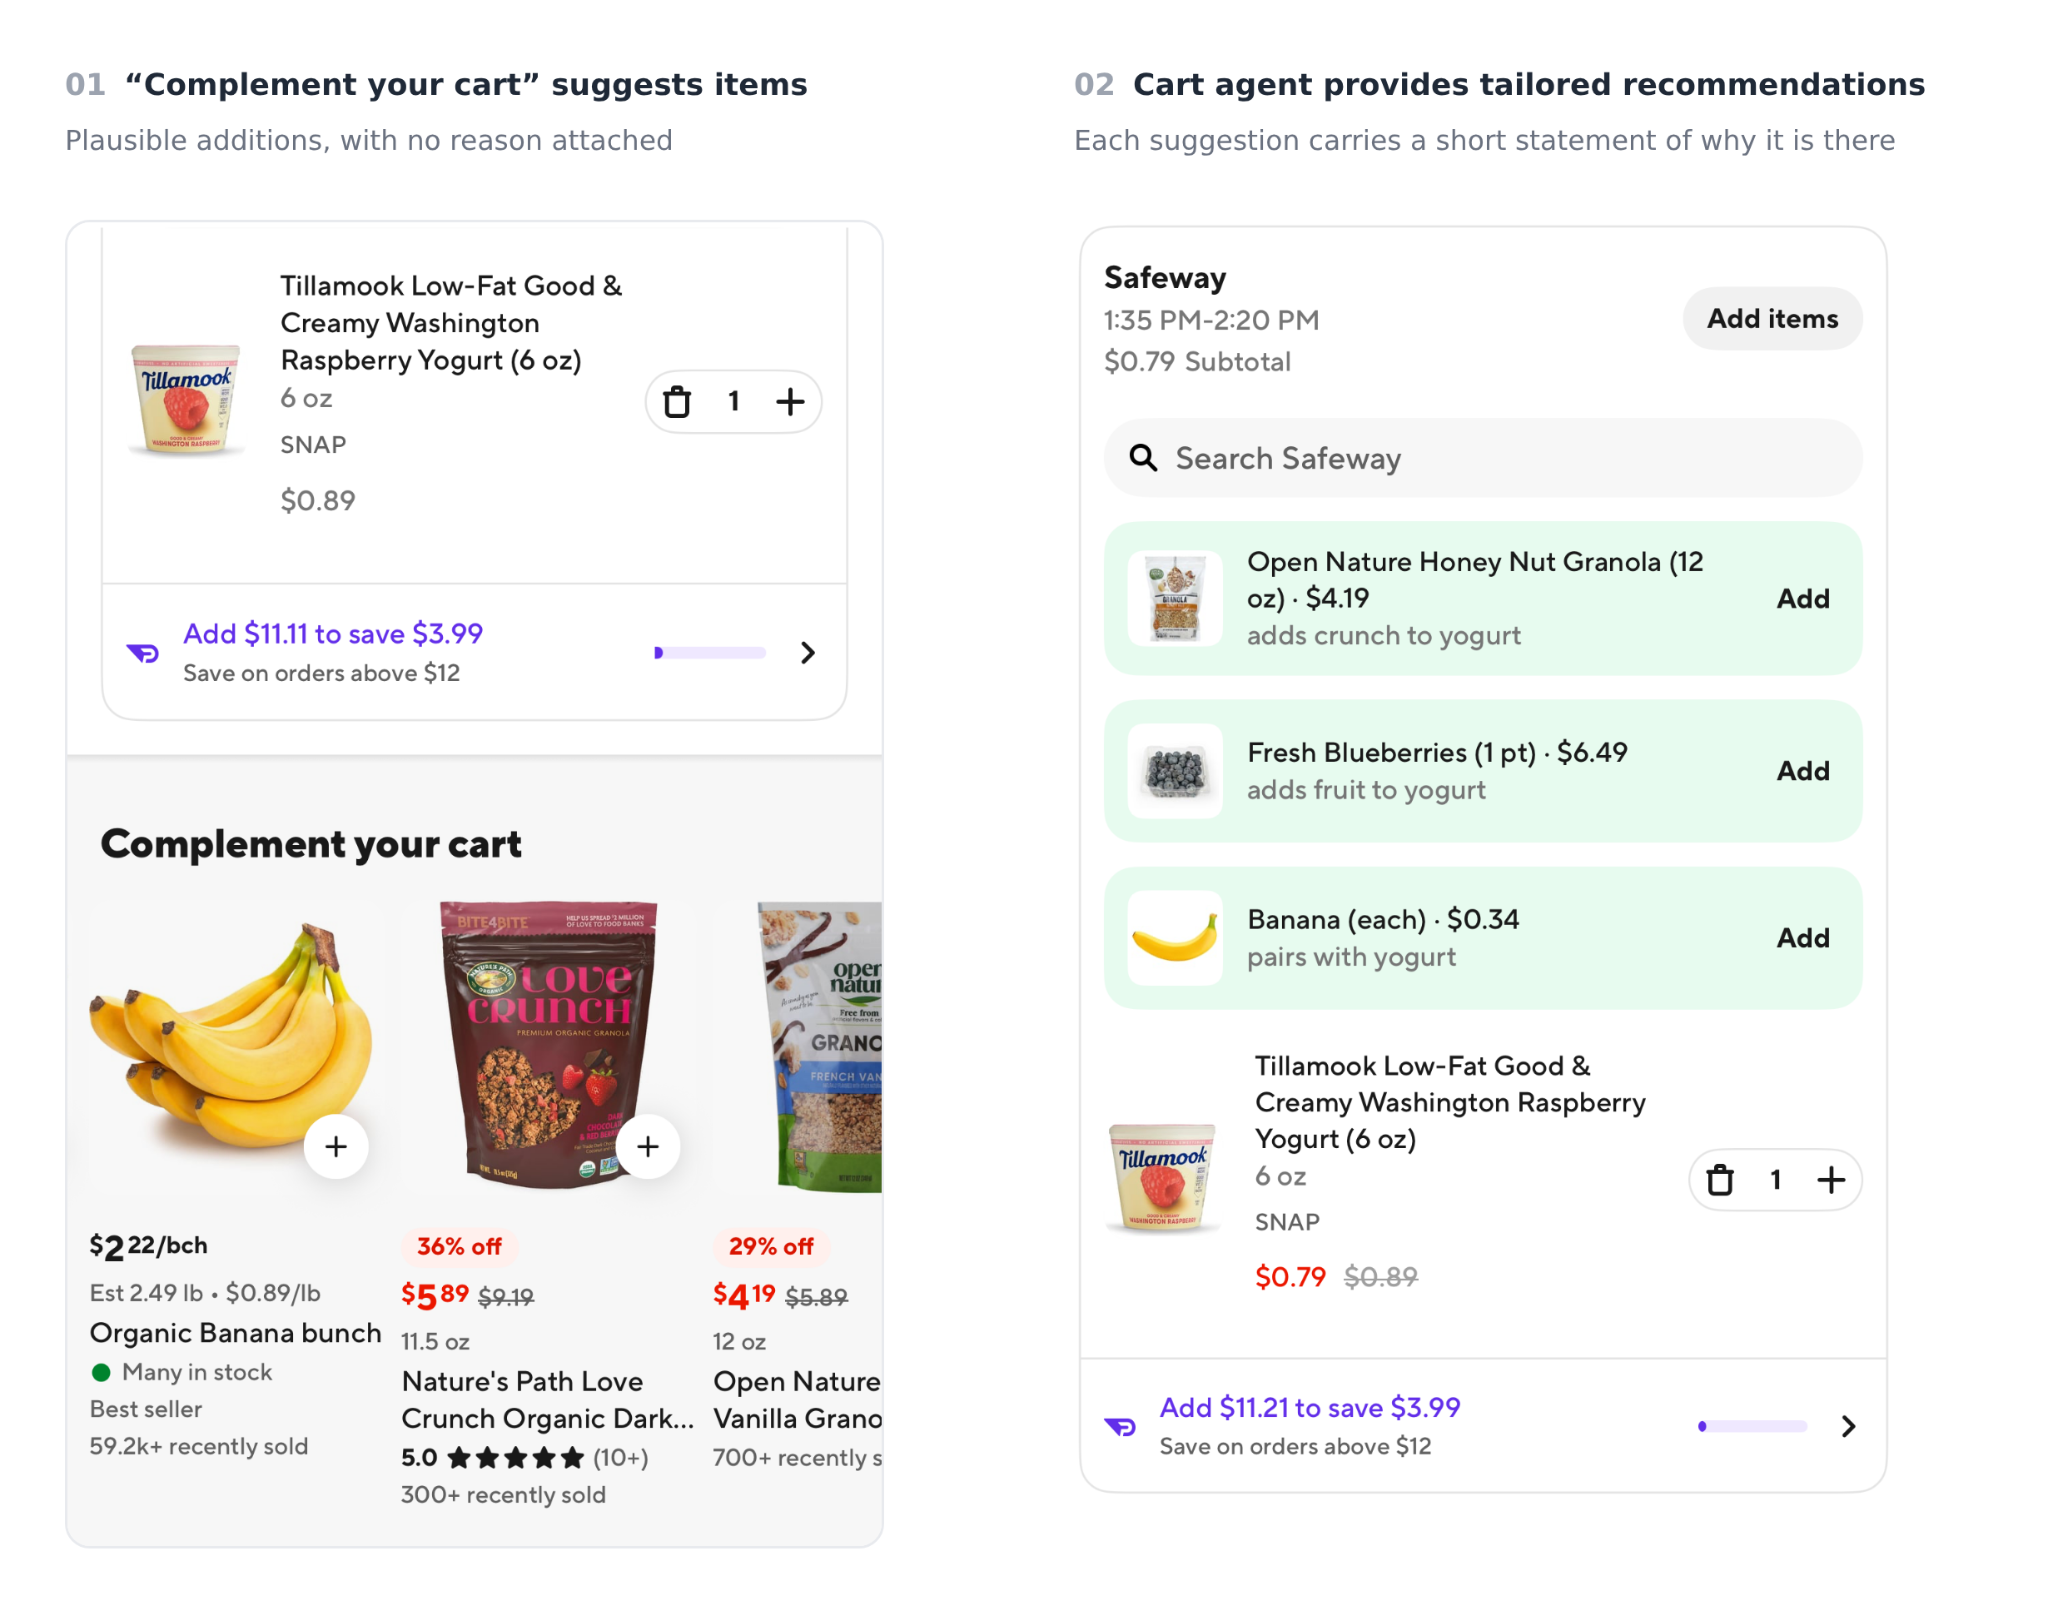
Against a cart holding raspberry yogurt, tapping “Recommend cart pairings” returns two suggestions: granola, “because it goes with your yogurt”, and blueberries, “to add fruit to your yogurt” (see Figure 3). The contrast case already exists in our own product, on the same screen: the cart page carries a complementary-item carousel that offers items a consumer may want to add, with no reason attached. Our cart agent could have returned exactly that, a list of plausible items. The items might well have been the same either way. The rationale is what tells the consumer the suggestion was reasoned rather than merely plausible, and since every widget is also a place to act, that distinction does real work.

That is what grounding buys: the difference between a compelling shopping experience and a novelty. If the output of the assistant is not tangible, consumers have little reason to shift away from the rich app experience DoorDash already provides. Text still does the work, but in a supporting role. We deliberately put the assistant’s rationale inside the widgets and around them, instead of showing item cells exactly as they appear elsewhere in the app.

Grounding also has to hold at the level of the data, and there the work is split. An agent chooses a supported content type and supplies the commerce data for it; the iOS client owns presentation and interaction, mapping that content onto native DoorDash design system components. A grocery request produces an editable shopping list with quantities, substitutions, and a subtotal. A restaurant request can produce store cards, item cards, or cart suggestions.

That split is what grounds the data itself. The commerce values in a widget do not come from the model. Prices, inventory, store hours, and cart contents are read from the same systems of record that the rest of the app uses, so a price shown in Ask matches the price on the store page at that moment. Typed content also gives the backend and client a stable contract. Supporting a new widget takes more than a prompt change. The agent has to know when to use it and what to put in it, and the client needs a named schema plus the code to decode and render it. Past that, a new widget reaches the consumer over the same conversation and streaming machinery as every other one.

Figure 3: Two kinds of suggestions against the same cart. Only one of them says why.

Widgets as I/O channels

Each new widget we have integrated has made the assistant feel more functional. The reason has as much to do with input as with output. One boundary governs all of them: a deterministic edit stays in the client and applies to the artifact directly, while a change that requires judgment starts an agent turn. The examples below are organized around where that line falls.

The hackathon build asked which store the consumer wanted, then waited for them to type it. It had no way to choose for itself; today that choice is automatic. Plenty of other questions still need the consumer, and direct text can be a poor way to collect the answers. Text entry is a single-threaded constraint: the consumer may know every answer, but can only supply them as fast as they can type or speak.

This is where widgets earn their place. A consumer may have ten operations to apply to a shopping list, each of them simple. Individually they are trivial; described in prose they become a complex task. It is the difference between looking over someone’s shoulder and telling them which buttons to press, and pressing the buttons yourself.

Structured clarifying questions are the clearest case, and the pattern is borrowed from coding agents: Claude Code’s AskUserQuestion tool does the same job for developers. We ship a widget that interrupts the consumer with a small set of questions (multiple choice and multi-select), letting them steer the conversation at genuinely open-ended points. It has become a core pillar of the interaction model in the grocery agent, and is now being adopted in the restaurant agent to simplify the same class of exchange. We integrate with our consumer memory platform, which narrows choices significantly, but knowledge gaps still remain that need consumer input. Asking is unavoidable. But we can ask in a way that is easy and efficient for the consumer to respond to.

The full-page list view is where the input/output collaboration becomes concrete. A consumer can change the quantity of an item, delete an item, swap an item for one of the alternates the assistant found alongside it, and add the finished list to their cart. Every one of those actions manipulates the artifact directly. None requires the assistant to act on the consumer’s behalf, and none costs an LLM round trip. The swap case puts the hackathon build’s candidate sets to better use. The alternatives a consumer chooses between are the other candidates the assistant retrieved when it selected the item. The list of all options available to the consumer previously filled a carousel. Now they sit one tap behind a decision instead of spread out in front of the consumer as an open question.

Changing the store is the exception, and the exception is the interesting part. It is not a mutation of the existing list. It escalates into an assistant request that rebuilds the list at the alternative store. This interaction is also rare: it was the first action in 0.1% of engaged sessions, which is roughly what we would expect if the line is drawn in about the right place. Put that line in the wrong place and the consumer either waits for the assistant to do something they could have done with a tap, or taps their way through something that could have benefited from the assistant’s judgment.

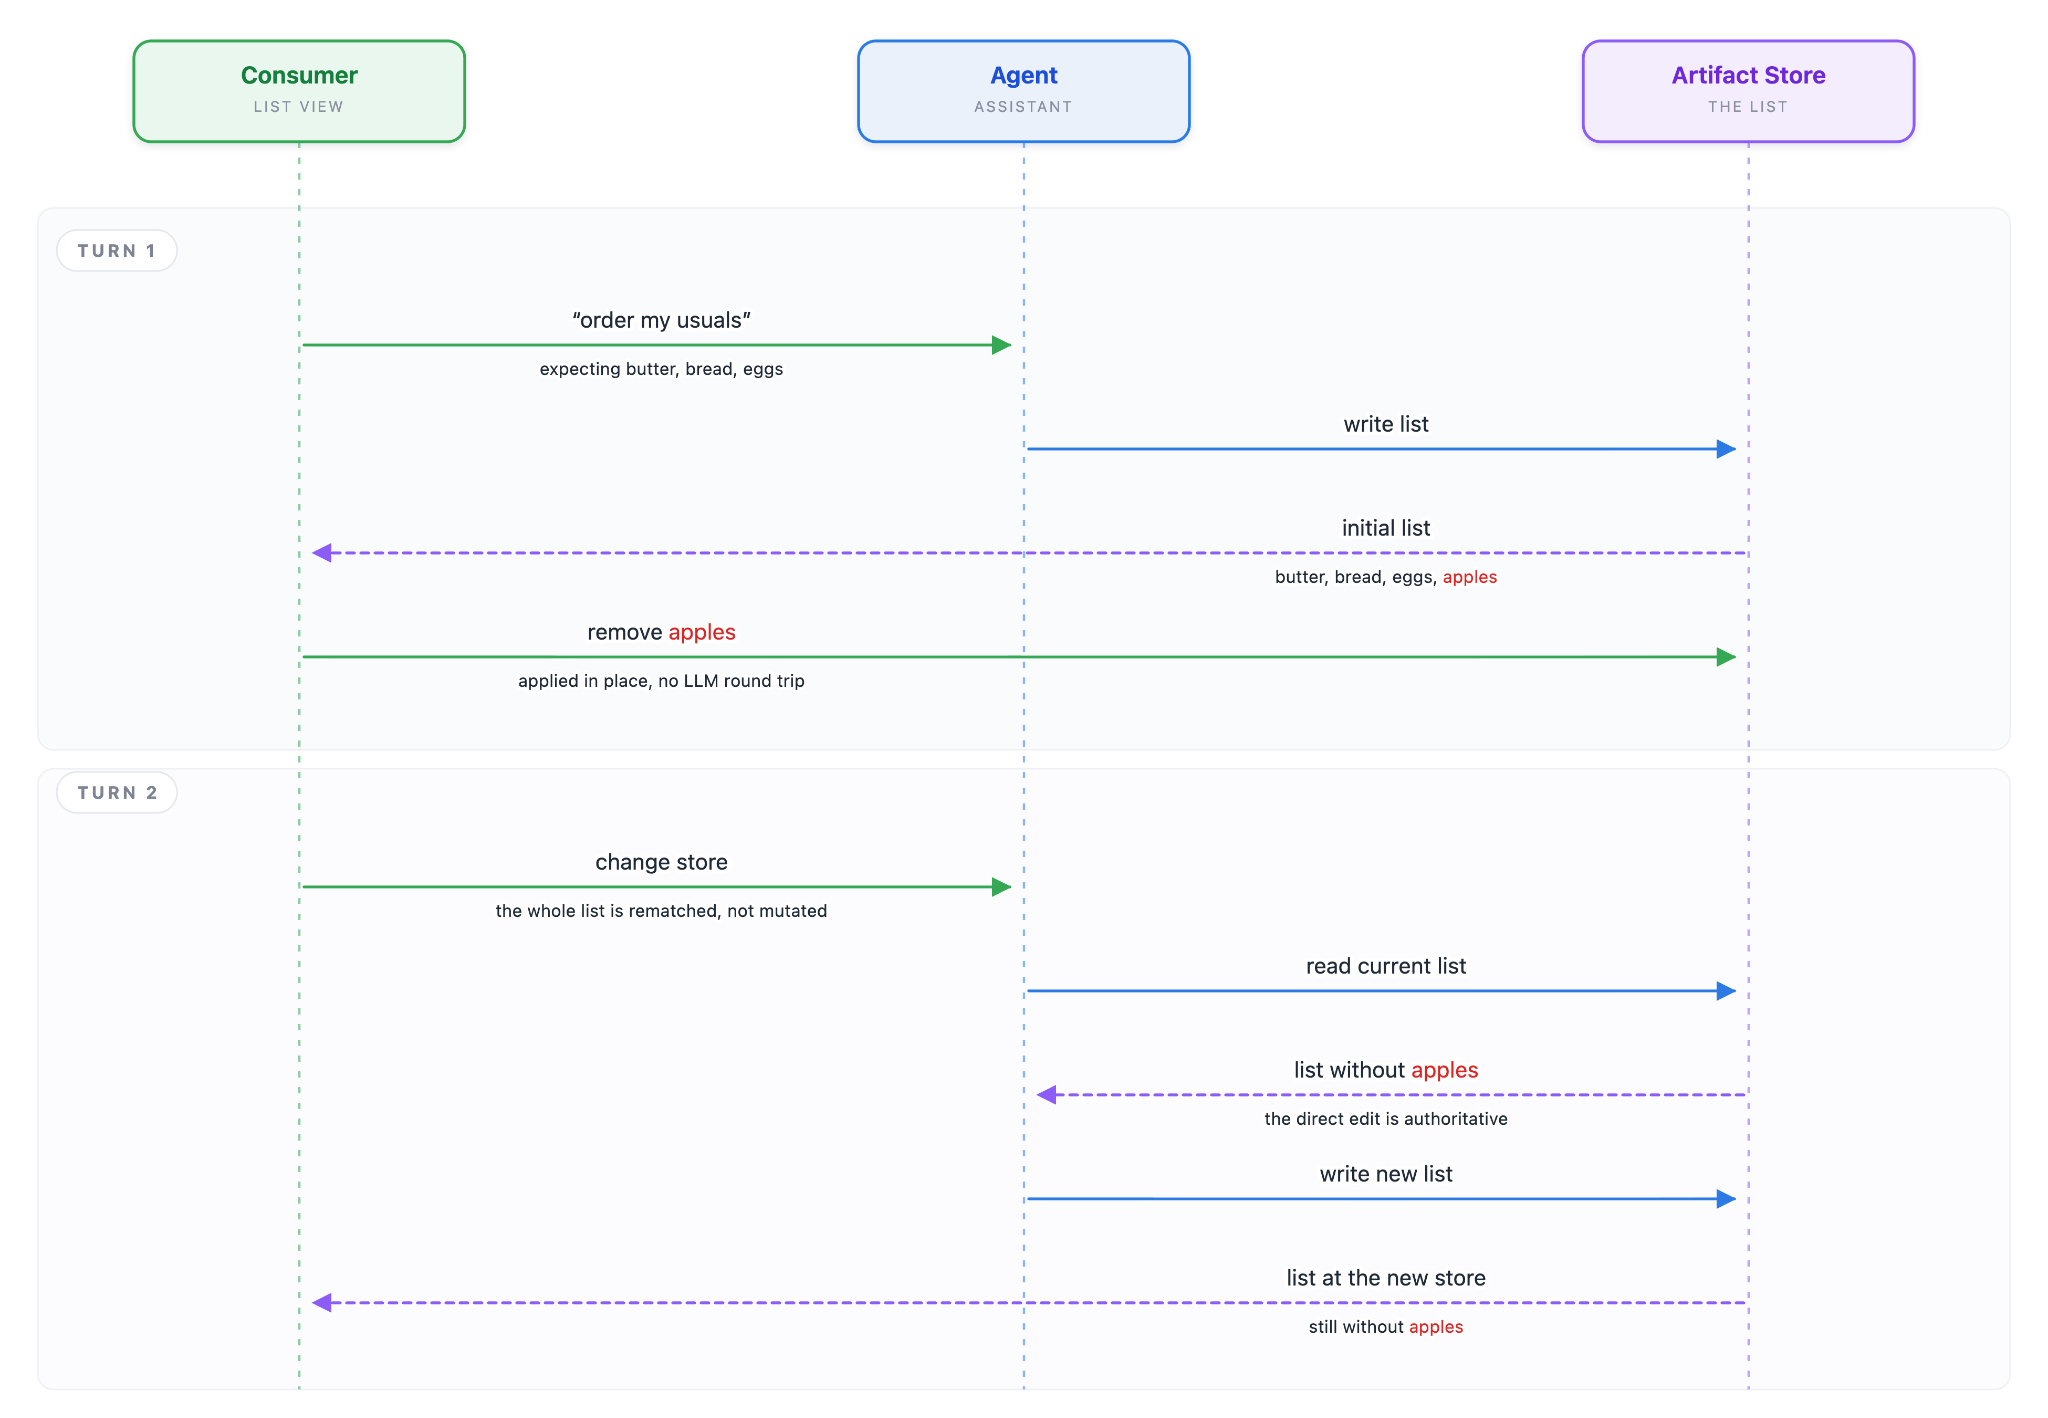
The artifact makes the split safe, and the two sides write to it differently. A quantity change, a removal, or a swap takes the short path: the client updates the list in place and the edit appears immediately. A store change starts an agent turn instead, because the whole list needs rematching against a different catalog. An agent revision does not overwrite what was there; it produces a new list derived from the previous one.

The effect is that a direct edit is authoritative. Before a turn changes the list, the agent reads the current one rather than working from the transcript, so if the consumer removes oat milk, the next turn begins from a list without oat milk.

The measured behavior over the same period shows where that line sits. Immediately after the first request, nearly three quarters of first next actions came through a component. From the second message onward it inverts, and typed follow-ups make up the majority at every depth that we measured. Controls absorb the immediate, structured refinements; language takes over when the change is larger or harder to express as a tap.

Figure 4: The list across a turn boundary. The consumer removes the apples directly in the list view, with no model round trip. When the store change starts a new turn, the agent reads the artifact rather than the transcript, so the list it rebuilds at the new store is still without them.

Every assistant revision stays live

When the assistant revises a shopping list, the version it replaces stays on screen and stays usable.

That was not our first implementation. The first version hid superseded lists: once a revision arrived, the list behind it could no longer be viewed or edited. One current list, no clutter. It seemed like tidier behavior. What it did instead was make revision feel expensive. If asking for a change might erase a list you were happy with, the safe move is to stop asking, and that undercuts the whole point of a collaborative flow.

So every assistant revision now produces a new artifact derived from the previous one, and each stays where it was created in the conversation. Scroll back and the earlier versions are all still there, still live: a consumer can open an earlier list, edit it, or add it to their cart instead of the latest one. Asking for a change costs nothing, because what they had a moment ago is one scroll away.

Not every list the assistant builds becomes a version the consumer sees. When it assembles a candidate list and concludes the store does not carry what was asked for, that list is never rendered. The consumer is told in text that the store was missing items and that a new list is on the way. It is one of the few places where prose does the work outright, and for the reason behind everything else in this post: interaction is used to simplify, and text is used to justify.

Where a list becomes a cart

An assistant that edits the cart directly can remove an item the consumer wanted, or add one they never confirmed, without being asked. One misstep there is enough to lose a consumer’s trust, because the failure is silent and it lands on the thing they are about to pay for.

So we instead present a shopping list as a proposal. It can hold dozens of items and go through several rounds of revision, whether that means removing a pantry item the consumer already has, changing a quantity, swapping a product, or regenerating part of a recipe, and none of it touches the cart. Committing takes an explicit “Add to Cart”, which is the simplest structure we found that gives the consumer real control without making them supervise every step.

The two objects still have to be reconciled, and the interesting choice is who does it. The assistant reads the cart while building the list, but it does not quietly adjust the list to match: if a recipe needs two bananas, the list asks for two, whether or not there are already four in the cart. Building the list for exactly what was requested, and reconciling it against the cart as a separate step, keeps one decision in one place.

That step surfaces at commit time. When the list and the cart overlap, the consumer is shown the duplicates and chooses whether to replace those quantities or add to them. It is a small moment, but small moments like this are where trust is won or lost.

Carrying context across DoorDash

It is not enough for the assistant to live in one location; it has to be reachable from anywhere in the app. Opening the assistant is already a strong signal of intent, but an ambiguous one. A consumer at that moment may be ordering from a favorite restaurant, buying groceries for the week, shopping for a new pair of headphones, or looking for support on a past order. A consumer who has navigated to a particular grocery store is showing a much sharper signal: it is probable they intend to build a cart at that store. Getting that context to the assistant is what lets it focus on the likely intent instead of asking.

The scope system we designed for this spans the client and the Gateway. The client attaches key pieces of entry context to each request: the topic the consumer entered under (grocery, restaurant), the store they are looking at, and a few related identifiers. The Gateway uses the topic to decide which agent the turn routes to, and the rest to give tools the identifiers they need.

Scope is deliberately a flat set of key-value pairs rather than a typed schema, and the client decides what goes into it. Unrecognized keys are carried through rather than rejected, so a new surface can start sending context without waiting on a Gateway change. The exception is the topic itself: adding a new one means teaching the Gateway which agent it routes to. So, while a new surface is cheap, a new domain is not.

The topic is also the part that applies only to the first message of a context. That gives the assistant solid ground to work from without being overly prescriptive, and it is what lets consumers break out of a scope when they explicitly choose to. A consumer using the assistant inside a restaurant can leave the restaurant scope entirely by asking it to “find me a recipe for this dish, and build me a cart, so I can make it at home.” That request is not free, but the cost is a hop inside the turn rather than a dead end: the restaurant agent has to recognize the request as outside its domain and hand it back before another agent picks it up.

In certain cases, scopes can also allow us to skip the model entirely. Take the “Reorder my last cart” entry point. It could simply send that phrase to the assistant as a message, and while that would work, attaching a scope lets us be more targeted. The “reorder” case is effectively deterministic, so we can bypass the LLM and hand back a shopping list almost immediately. What comes back is an ordinary shopping list widget: the consumer can change quantities, swap products, or ask the assistant to revise it in the chat, exactly as they would with any other. Note that the bypass only holds if the store still carries everything in the previous cart; if an item is unavailable, the request goes to the grocery agent, which rebuilds the list the same way it would from a typed request.

Scoping is also what makes a single continuous chat across an app session possible, but it only works because scope, agent pinning, and session state are kept separate. We treat scope as per-turn context. The pin, described earlier in the blog post series, keeps follow-up turns with the agent that resolved the previous turn. Both the pin and the transcript (the actual conversation) are held against the chat rather than the scope, so a consumer walking from one store to another re-points the pin at a new domain agent without discarding what was said. Several agents specialize underneath, and the whole thing still behaves as one assistant.

Figure 5: One chat, entered from two places. Scope rides along with each request, so asking inside Safeway builds the list at Safeway.

Conclusion

Agent integration into consumer products is still early. However, the foundations are becoming clear. Widgets are where consumers do the work and the consumer/agent conversation is what steers them. There are currently three readers of our shopping list artifact, each needing a different view of it. We use the user-facing part of this to ground the consumer in real products and to make common modifications one-tap actions. As agents take on more of the work, we expect what a consumer needs to see and what an agent needs to reason over will continue to change, and the line between an app interface and a chat interface will become harder to draw.

DoorDash’s experimentation platform manages over 60,000 feature flags across roughly 623 repositories. We identified over a thousand stale feature flags; in other words, the feature they once gated is fully shipped, but the flag and its branching logic still sit in the codebase as dead weight. Cleaning just one up manually takes an engineer one to two hours. With about 2,300 new flags being created every month, the backlog only grows.

So we built a multi-agent LLM system that cleans up stale flags end-to-end from a Jira ticket to a merge-ready pull request (PR) with no human in the loop except an engineer confirming the target value and the PR landing. Of the 50 most recent stale flags it processed, the system produced usable PRs for 45 of them at an average cost of $4.79 and 13.8 minutes per flag, saving countless human engineering hours. The system we built not only had to be effective, but its reliability boundary needed to be completeness, not correctness; if the agent failed, it had to do so safely without making any breaking code changes.

This post covers why off-the-shelf tools couldn’t accomplish this in our codebase, how we designed the system, and what we learned during its deployment. Note: This work was peer-reviewed and accepted for the ICSME 2026 industry track.

Why stale feature flags are worth automating away

Feature flags are a cornerstone of modern software delivery. They let us roll out features gradually, run A/B experiments, and flip kill switches when something goes wrong. But every flag has a lifecycle and once a feature is fully rolled out, its flag becomes stale. stale feature flags are often left as technical debt because an engineer’s time has more value building new features instead of cleaning them. 

Its conditional logic no longer serves a purpose, but it doesn’t just sit there harmlessly:

  • Stale flags can remain in the codebase for years. Prior research found that roughly 25% of feature flags persist for more than eight years in open-source projects; practitioners consistently report that cleanup is burdensome and repeatedly deferred.
  • A stale flag is technical debt. Every stale flag adds a branch, an edge case, and a bit more to read and reason about, which can be especially painful during an incident.
  • Stale flags can be an operational risk. A stale flag preserves a dormant code path that can be reactivated by accident. In one well-documented case, a trading firm repurposed a stale flag during a deployment, triggering $460 million in unintended trades in just 45 minutes.

Multiply tens of thousands of flags and a four-figure monthly creation rate and it becomes clear that manual cleanup simply cannot keep pace. Clearing our stale backlog by hand would cost thousands of engineering hours that would be better spent building.

Dynamic values

Feature flags at DoorDash are called dynamic values (DVs). They are powered by our experimentation platform. Throughout this post, the term DV is synonymous with feature flag.

A DV’s lifecycle follows the pattern creation → experimentation → rollout → stale → removal. We classify a DV as stale when it meets all of the following criteria:

  1. It hasn’t been modified in 90 days.
  2. It’s still referenced in code.
  3. It’s not already in an end-of-life status (archived or retired).
  4. It’s not on an exclusion list.

A daily cron job files a STALEDV Jira ticket for each identified stale DV and assigns it to the DV’s creator. This marks the front of the queue from which our cleanup system works.

Agentic workflow vs. AST-based cleanup tools

The best-known automated approach to flag cleanup is Piranha and its polyglot successor, which simplify flag-gated conditionals by matching patterns in the abstract syntax tree (AST). It works well when a flag is read through a direct API call that a rewrite rule can pattern-match.

But that’s not how DVs are accessed at DoorDash. Our services use a three-layer, dependency-injected wrapper pattern:

// Layer 1: RuntimeKeys.kt – the DV name as a string constant
object RuntimeKeys {
  const val ENABLE_X = “enable_feature_x”
}

// Layer 2: FeatureFlags.kt – a DI wrapper that calls the DV client
@Singleton
class FeatureFlags @Inject constructor(
    private val dvClient: DynamicValuesClient
) {
  fun shouldEnableX(userId: String): Boolean =
    dvClient.getBoolean(ENABLE_X, withContext(“user_id” to userId), false)
}

// Layer 3: business logic – uses the flag via dependency injection
class MyService @Inject constructor(
    private val featureFlags: FeatureFlags
) {
  fun process(userId: String) {
    if (featureFlags.shouldEnableX(userId)) handleNewPath()
    else handleOldPath()
  }
}

This is a clean separation of concerns, but it means the DV name, the API call, and the conditional logic each live in a different file, connected only through method calls and dependency injection. These are semantic relationships, not syntactic ones; AST pattern-matchers can’t follow them. 

Target-value determination

There  is an additional problem a source-code-only tool cannot solve: target-value determination and live rollout querying. A tool that only reads source code could confidently hardcode the wrong value and silently change behavior. Ensuring the tool performs the correct code cleanup requires knowing the flag’s live rollout state, which lives in the experimentation platform, not the repo. For example, DoorDash’s experimentation platform supports the usage of integer, string, and JSON feature flags. A live readout of the target value ensures that the tool is modifying the code with the feature flag’s correct value that represents the system’s current state. Similarly, rollout information is also an important part of the equation. An experiment may have been rolled out to 60% and then abandoned. The tool would need to have the intelligence to determine that this is a partial rollout and ask the user for confirmation before performing any cleanup. This can either trigger the user to complete the rollout/rollback before using the tool to perform the cleanup, or prompt the user to skip the cleanup for now.

Scale and complexity

Finally, even a simple Boolean DV can touch five to 20 files after accounting for the constant, the wrapper, every call site, and updating or deleting relevant tests. This is a job that needs to understand code, not just match syntax. This is exactly why we opted to use LLM agents. But the job wasn’t as simple as writing a prompt and asking the agent to perform the cleanup; that would not achieve a cost- and time-efficient cleanup with guardrails at scale.

A two-phase, human-in-the-loop pipeline

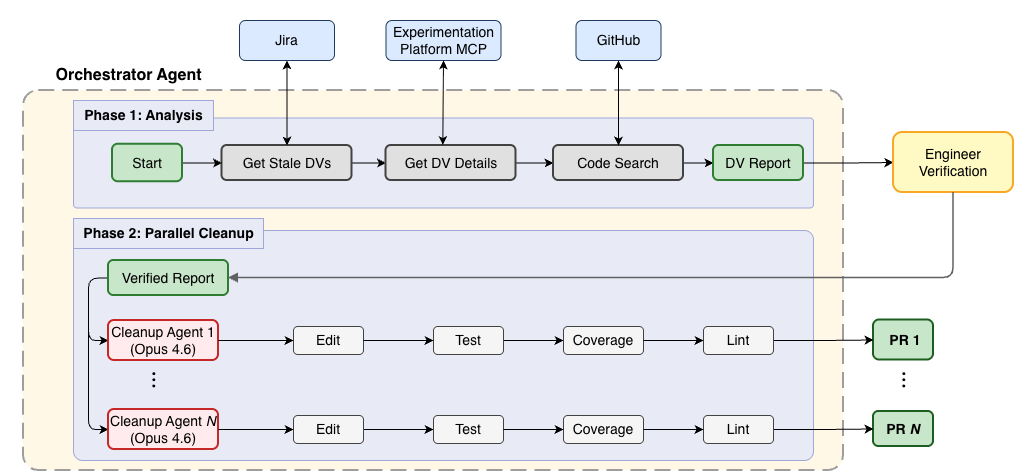
The system is built on Google’s Agent Development Kit (ADK) and runs in two phases with a single human checkpoint between them, as shown in Figure 1.

Figure 1: System architecture. An orchestrator agent runs the Phase 1 analysis, pulls stale DVs from Jira, queries the experimentation platform for rollout state over the model context protocol (MCP), and searches the codebase; an engineer verifies the report. Phase 2 then spawns parallel cleanup agents in isolated git worktrees that edit, test, check coverage, and lint before opening a PR.

Phase 1: Analysis and report

An orchestrator agent, in this case Claude Sonnet, processes stale-DV requests. For each DV, it:

  1. Fetches the stale DV Jira tickets via the Atlassian command-line interface tool.
  2. Queries DoorDash’s experimentation platform over model context protocol (MCP) for the DV’s metadata — its UUID, rollout percentage, and target value.
  3. Discovers the local repository and searches for every code reference to the DV.
  4. Generates a structured report proposing a target value and listing the affected files for each DV.

That MCP integration is the quiet hero of the design. By reading the live production rollout state, the agent determines the correct target value instead of guessing from the code. For example, a DV that was introduced for a feature that ended up being abandoned shows a 0% rollout on the platform, so the agent knows to remove it using the baseline value rather than assuming the feature is on.

Human checkpoint

Before any code changes, an engineer reviews the report and confirms each DV’s target value. This is a deliberate safety valve for ambiguous cases, such as partial rollouts or abandoned experiments, where the right answer needs human judgment. For example, an experiment may have been rolled out to 60% and then abandoned. The human checkpoint allows the user to intervene by deciding, for instance, whether to complete the rollout or roll back the experiment before the cleanup proceeds.

Phase 2: Parallel cleanup

For every confirmed DV, the orchestrator spawns a dedicated removal agent — Claude Opus — with each running in its own isolated git worktree. Up to four agents run concurrently per repository, which is configurable. Each one drives a full cleanup and opens a pull request assigned to the DV’s owner.

Inside a removal agent

Each removal agent runs an iterative workflow as follows:

  1. Search for all references to the DV, including the constant, the wrapper function, and every call site.
  2. Decide a cleanup strategy based on the DV’s type — Boolean, integer, or string — and its usage.
  3. Apply the edits; replace wrapper calls with the target value and simplify the now-constant conditionals.
  4. Remove the wrapper function, the definition, and the constant.
  5. Update or remove affected tests, such as deleting “flag disabled” test branches.
  6. Confirm the build passes.
  7. Confirm the tests pass.
  8. Verify patch coverage is at least 95% on changed lines.
  9. Run the Detekt linter.
  10. If any validation fails, diagnose, fix, and retry.

Autonomy over a codebase only works if the guardrails are real. Four mechanisms keep the agents safe:

  • Git worktree isolation: Each agent works in a dedicated worktree, so concurrent agents never step on each other, and a failed cleanup is discarded by simply removing the worktree.
  • A one-hour hard timeout per agent: This ensures that a stuck session can’t run away.
  • JaCoCo patch-coverage validation: This enforces at least 95% test coverage on the lines the agent changed.
  • Detekt static analysis: This enforces style and catches common issues.

We also run Gradle with –no-daemon to eliminate cross-worktree state pollution during parallel runs. Crucially, an agent is not allowed to open a PR until tests and static analysis pass locally.

Results

Building a system is one thing, but only one question matters when it runs at DoorDash’s scale: How well does it work? In this case, very well indeed.  Of the 50 most recent stale flags the system processed, it produced a merge-ready PR for 45 of them at an average cost of $4.79 and 13.8 minutes per cleanup instead of the one to two hours a manual cleanup would have taken. The system introduced no bugs or regressions along the way.

How we evaluated it

We evaluated the system on the 50 most recent stale DVs it processed across several Kotlin repositories. We labeled each by complexity: 

  • Simple — A single Boolean check in one to two files; n=6
  • Medium — Multiple usages across three to five files with some test changes; n=18
  • Complex — nested conditionals, cross-file dependencies, non-Boolean types, or significant test updates; n=26 

By type, 41 were Boolean, six were string, and three were integer/long. Each PR was judged on three criteria: CI passes — including the 95% patch-coverage gate — code correctness, and developer review. 

Outcomes by complexity

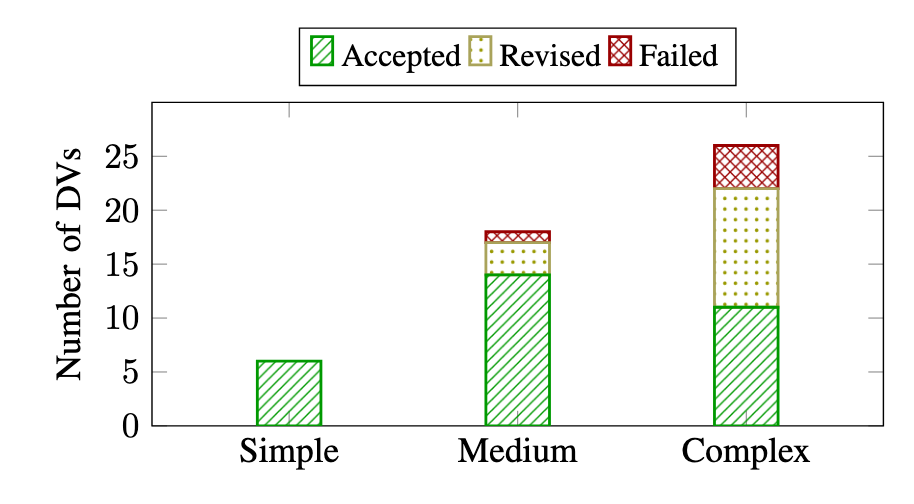
Figure 2: Cleanup outcomes by complexity. Simple DVs are 100% accepted on the first shot; medium DVs reach a 94% cleanup rate; complex DVs show more revisions and failures but still reach 85%.

As shown in Figure 2, 31 of the 50 cleanups were merged in the first shot, 14 needed one minor revision, and five required an engineer to step in. The complexity breakdown maps the system’s reliability boundary:

  • Simple DVs: 100% cleaned up in a single pass.
  • Medium DVs: 94% (17/18) 14 done in a single pass, three after one revision, and one needing engineer intervention.
  • Complex DVs: 85% (22/26), even with cascading parameter removal through more than five method layers, nested conditionals, and heavy test refactoring.

The 14 revisions were minor and self-correcting; six were insufficient patch coverage requiring one more iteration to add tests, and eight were incomplete dead-code removal with a leftover variable or reference deep in a call chain. However, all were fixed in one re-prompt of the LLM.

The most important finding had to do with what kind of thing went wrong. Across all 50 generated PRs, we observed no bugs or regressions introduced by the changed code. Every one of the five intervention cases came down to call-chain depth with cross-interface parameter threading; the agent correctly removed the majority of the dead code, but missed a link or two in a long multi-file chain. In other words, the system’s reliability boundary is completeness, not correctness, alleviating concerns that the system could create larger problems when it was unsuccessful.

Cost and time

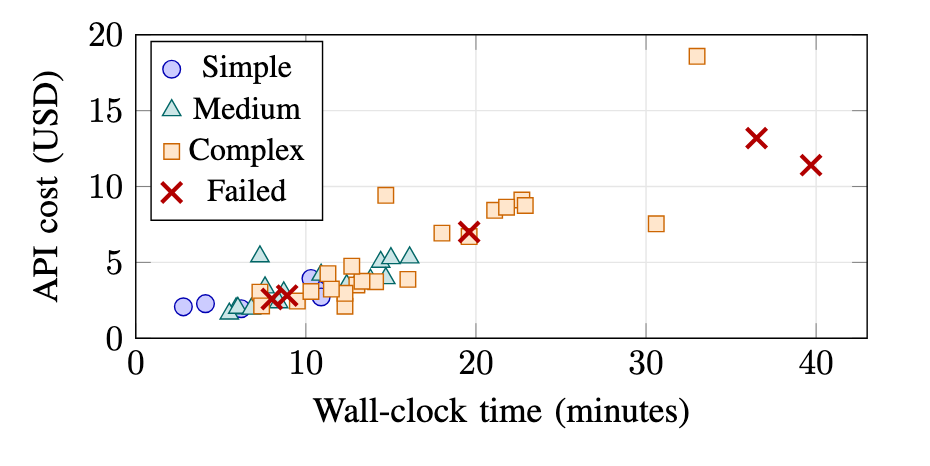
Cost and time scale with complexity, but stay firmly in “run-it-at-scale” territory, as shown in Table 1 and Figure 3. 

Table 1 breaks down the average and median performance metrics, specifically time and cost, for the 50 analyzed feature flags categorized by their complexity. This data highlights that while more complex flags naturally require more time and budget, the system remains highly efficient even for the most difficult cleanup tasks.

ComplexitynAvg. timeMedian timeAvg. costMedian cost
Simple67.5 min8.2 min$2.69$2.50
Medium1810.4 min9.9 min$3.46$3.42
Complex2617.7 min14.4 min$6.20$4.50

Table 1: Performance metrics by complexity level across 50 evaluated feature flags.

Figure 3: API cost vs. wall-clock time for each DV, colored by complexity. Simple and medium DVs cluster in the low-cost, low-time region. Complex DVs spread out, with a few outliers approaching 40 minutes and $19. Failed DVs (×) skew toward longer runtimes.

As illustrated in Figure 3, simple and medium DVs cluster tightly in the cheap and fast corner. Complex DVs spread out, with a handful of outliers reaching roughly 40 minutes and around $19. Even at the top of that range, the agent represents a dramatic reduction in engineering effort and reduced costs against even a conservative one-hour estimate of what would be required to remove a single DV manually.

What we learned

  • Specializing models by role pays off. We use Claude Sonnet for orchestration, including broad context, lightweight metadata gathering and planning, and Claude Opus for the removal agents, including deep reasoning about code semantics, call chains, and test dependencies. Reserving the more expensive model for the cognitively demanding editing phase cut our overall API cost without hurting cleanup quality.
  • Worktree isolation is non-negotiable for parallel agents. Our early experiments without worktree isolation produced race conditions where concurrent agents edited the same files and generated corrupted diffs. A dedicated worktree per agent plus –no-daemon Gradle made parallel cleanup safe and made failure disposable.
  • Live experimentation integration was the highest-leverage decision. Without the current rollout state, any automated approach — rule-based or LLM — risks hardcoding the wrong value and quietly preserving the wrong behavior. Reading it over MCP added negligible latency and eliminated a whole class of target-value errors.

Any team considering similar automation should note that our results point to three practical prerequisites: 

  • A reliable source of deployed flag state
  • Worktree isolation for parallel edits, and 
  • Deterministic validation gates before a PR is ever opened.

What’s next

We’re extending the system along two lines:

  1. A phase 1 confidence score to auto-approve low-risk cleanups. For example, a Boolean DV at 100% rollout whose code default already matches production, which reserves the human checkpoint for genuinely ambiguous cases.
  2. A post-cleanup code-quality pass. This would catch semantic issues such as variable names that no longer reflect their purpose once a flag is gone.

Feature flag cleanup is the kind of work that’s individually small, but collectively enormous, particularly at DoorDash’s scale, and perpetually deferred. By combining an orchestrator, parallel removal agents in isolated worktrees, live experimentation platform lookups, and hard validation gates, our feature flag cleanup system transforms a thousands-of-hours backlog into a cheap, reliable background process that produces merge-ready PRs for 90% of the flags it touches at a cost of about $4.79 and 14 minutes each, with no regressions. The remaining boundary is completeness on the deepest call chains, and that’s exactly where we’re focused next.

Interested in building systems like this? DoorDash Engineering is hiring – come help us build at scale.

Flux is DoorDash’s cloud-based agents platform for engineers. In a single month in 2026, we used Flux to automate 130,000 engineering tasks. Rapidly expanding after Q1 2026 debut, Flux already powers high-volume background workflows across DoorDash, including more than 25,000 automated code reviews each week, and more than 300 unique playbooks and 10,000-plus invocations used every week. These workflows can run unattended, in parallel, around the clock.

In this blog post, we’ll walk through the limitations that pushed us beyond local, laptop-based agent workloads, why we chose to build Flux in-house rather than rely solely on hosted coding agents, and the platform primitives such as agent sandboxes, MCP gateway, playbooks, and invocation surfaces to make agent delegation repeatable and secure.

Flux background workflow use-cases

Table 1: A snapshot of Flux usage across DoorDash in a single month, spanning automated code reviews, playbook runs, and background task completions

Where we started

Over the past year, users running agentic workloads on their laptops have quickly hit limitations:

  • Resources and availability. A laptop has a fixed number of CPU cores, limited memory, and a battery, all shared with every application on board. Agentic workflows often need to run compute-intensive tasks such as builds, tests, and large searches in parallel, causing laptops to run out of capacity fast. The workflows also depend on the device being powered on, connected, and available; work pauses when an engineer closes the laptop, loses connectivity, or steps away.
  • Safety controls. Laptops typically have broad access to sensitive credentials and systems, including SSH keys, VPN sessions, and authenticated tools. Giving an autonomous agent that same level of access creates unnecessary risk and a potentially large blast radius. Local environments also make it harder to tightly scope what an agent can access and for how long.
  • Visibility and auditability. When workloads run across individual laptops, execution is fragmented and difficult to monitor. It becomes harder to understand what is running, where it is running, on whose behalf, and which systems or files it has touched.

Our thesis to address these issues is simple: 

Delegate tasks to secure, autonomous coding agents so engineers can dedicate more energy to innovation, critical thinking, and solving complex problems.

Why we built Flux in-house

Hosted coding agents are useful, but they force a hard tradeoff: Either send sensitive code and execution context to a third party, or open a path from that third party back into internal systems. For DoorDash, the harder problem was not just getting an agent to write code; that’s mostly solved. It was giving that agent the right environment, tools, permissions, integrations, and constraints.

Our strategy is to control the primitives around the agent, including orchestration, sandboxes, workflows, permissions, integrations, and the DoorDash-specific context agents needed to work effectively. We also designed those primitives to be modular, giving us the flexibility to use the best third-party tool for each job or to build in-house when deeper security, integration, performance, or UX ownership matters. 

These primitives democratize workflow creation and make systems more adaptable to future use cases. Because they can be composed in different ways, teams can build new agent workflows without reworking the underlying infrastructure or prescribing how each engineer should structure their workflow. For example, we run both the evals for our code review on Flux infrastructure.

Primitives, not workflows

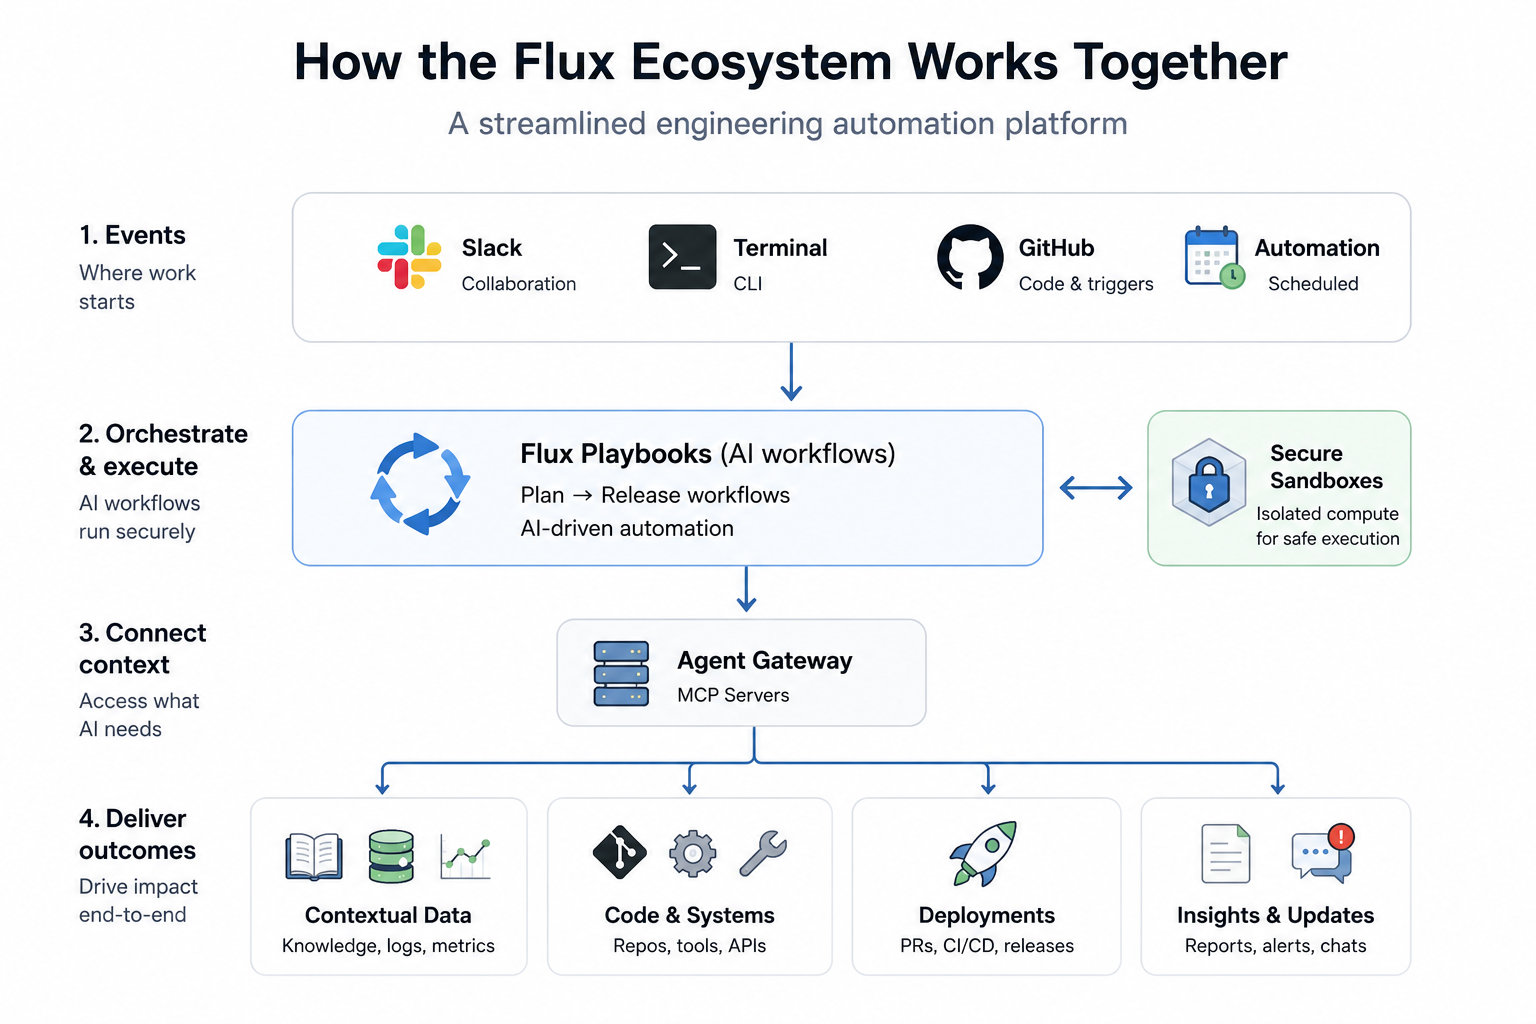
As shown in Figure 1, Flux is built around four platform primitives: sandboxes, the model context protocol (MCP) gateway, playbooks, and invocation surfaces. Together, they make agent delegation repeatable. A playbook defines the work. A cloud sandbox gives the agent a real place to do it. An agent gateway controls what systems the agent can access. And invocation surfaces allow engineers to start and receive work from the places they already use.

Figure 1: The four platform primitives that make up Flux — sandboxes, the MCP gateway, playbooks, and invocation surfaces — and how they connect to turn a task into work an agent can safely carry out

Sandboxes provide the execution environment

Local agents work well for interactive development, but they are a poor fit for unattended workflows. They depend on individual engineers’ laptops, compete for local resources, are difficult to audit, and do not scale efficiently across parallel tasks.

Flux moves execution into isolated cloud sandboxes backed by Firecracker micro virtual machines (microVMs) for hardware-level isolation. Each sandbox is provisioned with the repositories, developer tools, secrets, and runtime dependencies the task requires, giving agents a complete engineering workspace while providing DoorDash with a consistent execution, security, and observability model.

Controlling this layer lets us support real engineering workflows, including changes across multiple repositories and multiple pull requests from a single session. Flux has a 95th percentile service level objective of under five seconds for the full end-to-end setup — from starting the microVM to cloning the required repositories, installing build tools, and configuring the supported coding agent harnesses.

MCP gateway provides governed access

Agents need access to the systems that engineers use every day, including continuous integration (CI), observability platforms, issue trackers, deployment tools, code search, documentation, and service metadata. But granting broad, unrestricted access should not be the default.

Flux connects agents to internal systems through an in-house MCP gateway called Agent Gateway. Each playbook declares the tools it requires, and Flux grants only the scoped permissions needed for that task. Every action is logged, creating a clear audit trail.

This gateway architecture gives us a centralized control point for authentication, authorization, observability, usage tracking, and policy enforcement, all of which make agent access both safer and easier to operate at scale.

Playbooks define the work

A playbook is a reusable unit of agentic work — the equivalent of a Docker container for skills and agent-driven tasks on the Flux platform. Defined in a single markup YAML file, it packages the task, inputs, context, skills, tools, permissions, validation, expected outputs, and safety boundaries needed to execute work consistently.

Playbooks can combine agentic steps, which provide flexibility and judgment, with deterministic steps, which offer predictability, lower cost, and easier validation. This lets teams move logic between agent-driven execution and conventional code as requirements evolve, without redesigning the workflow.

Invocation surfaces meet developers where they are

The same playbook can be triggered from Slack, GitHub, cron, the CLI, or a conversational skill. That means teams can define a workflow once and invoke it from whichever surface best matches the moment:

  • Slack for collaborative delegation
  • GitHub for PR and CI automation
  • Cron for recurring maintenance
  • CLI for direct developer control, or invoked through a skill

This is what makes Flux easy to adopt.

Lessons learned

Building Flux taught us as much about product adoption as it did infrastructure, including:

  • Start narrow to earn trust. We began with automated code review instead of trying to automate the entire software development life cycle. Code review was frequent, measurable, and easy for engineers to evaluate. It gave us a production workflow where we could tune quality, latency, cost, and behavior before expanding into CI triage, on-call tasks, maintenance playbooks, and ticket-driven development.
  • Make the work visible. Our first Slack integration created private channels for each agent run. That made Flux useful for individuals, but it did not create team habits. Moving work into public threads changed the adoption pattern. Engineers could see what others delegated, watch Flux make progress, review the output, and build trust together.
  • Playbooks need enablement. Reusable workflows do not appear just because the platform exists. Workshops and hackathons helped teams translate repeated operational work into playbooks. The primitives made automation possible; enablement helped teams recognize which workflows were worth encoding.

What’s next

In future posts, we will go deeper into the platform primitives that make Flux work, and the developer experience for building new workflows. We’ll also discuss the applications we’ve built on top, including Flux Responder, our internal Slack agent.

Acknowledgements

Thanks to Adam Rogal, Adam Yarger, Andy Fang, Ashwin Kachhara, Fan Xia, Ivan Rudovol, Jason Prasad, Jialu Deng, Justin Block, Justin Deocampo, Justin Fan, Keith Lyall, Praneet Singh, Sean Chen, Tyler Berrett, and Volanda Zhu for their contributions to the platform and this post.

Stay Informed with Weekly Updates

Subscribe to our Engineering blog to get regular updates on all the coolest projects our team is working on
AI agents become useful when they can take action in real systems. At DoorDash, that means reaching internal APIs, engineering systems, observability platforms, ticketing systems, knowledge bases, and third-party SaaS products. The model context protocol (MCP) made those tools easier to expose by giving agents and servers a shared way to describe, discover, and invoke capabilities.

As agents moved from experiments into real workflows, we ran into a different problem. While MCP standardized the shape of a tool call, it did not answer key production questions around that call:

  • Which agent is allowed to call this tool?
  • Which user, team, or service is it acting for?
  • Which credential should be used?
  • Which subset of tools should the agent even see?
  • How do we revoke access?
  • How do we know what happened after the call?

These questions grow quickly. A coding agent might need GitHub, Jira, code search, continuous integration (CI), observability, and docs. A third-party MCP server might expose hundreds of tools when a workflow needs only five. A user-facing agent might need a user’s OAuth grant, while team automation should use a non-personal service principal. If each team solves these issues independently, every agent-tool pairing ends up with its own auth code, OAuth flow, secret handling, tool catalog, rate limits, and logs.

That’s why we built an Agent Gateway to make agent-tool access a platform capability. It is a single governed entry point where agents discover and invoke tools. The gateway authenticates the caller, checks authorization, exposes only the approved tool surface, injects the right credential, routes to the downstream MCP server, and records a structured usage event for every call.

The gateway is not just a proxy. It is the control plane for the agent ecosystem. It governs who can call tools, curates which tools agents can see, packages tools into task-oriented surfaces, and gives DoorDash one place to observe, rate-limit, revoke, and improve agent-tool access.

Problem: Tool access has three parts

While MCP helps agents invoke tools, the harder problem in production has three dimensions:

  1. The first is access. The platform needs to know who is calling, whether they are allowed, and which credential model applies: internal identity, gateway-held token, per-user OAuth, or service-principal access.
  2. The second is tool-surface curation. Agents should not receive a raw dump of every tool exposed by downstream MCP servers. Smaller, task-relevant catalogs improve safety, reduce model confusion, and make agents easier to operate.
  3. The third is operations. Tool calls need rate limits, traces, metrics, usage events, cost attribution, ownership metadata, and production visibility.

Our Agent Gateway exists because access, curation, and operations belong in one shared platform, not copied into every agent and every MCP server.

Gateway architecture

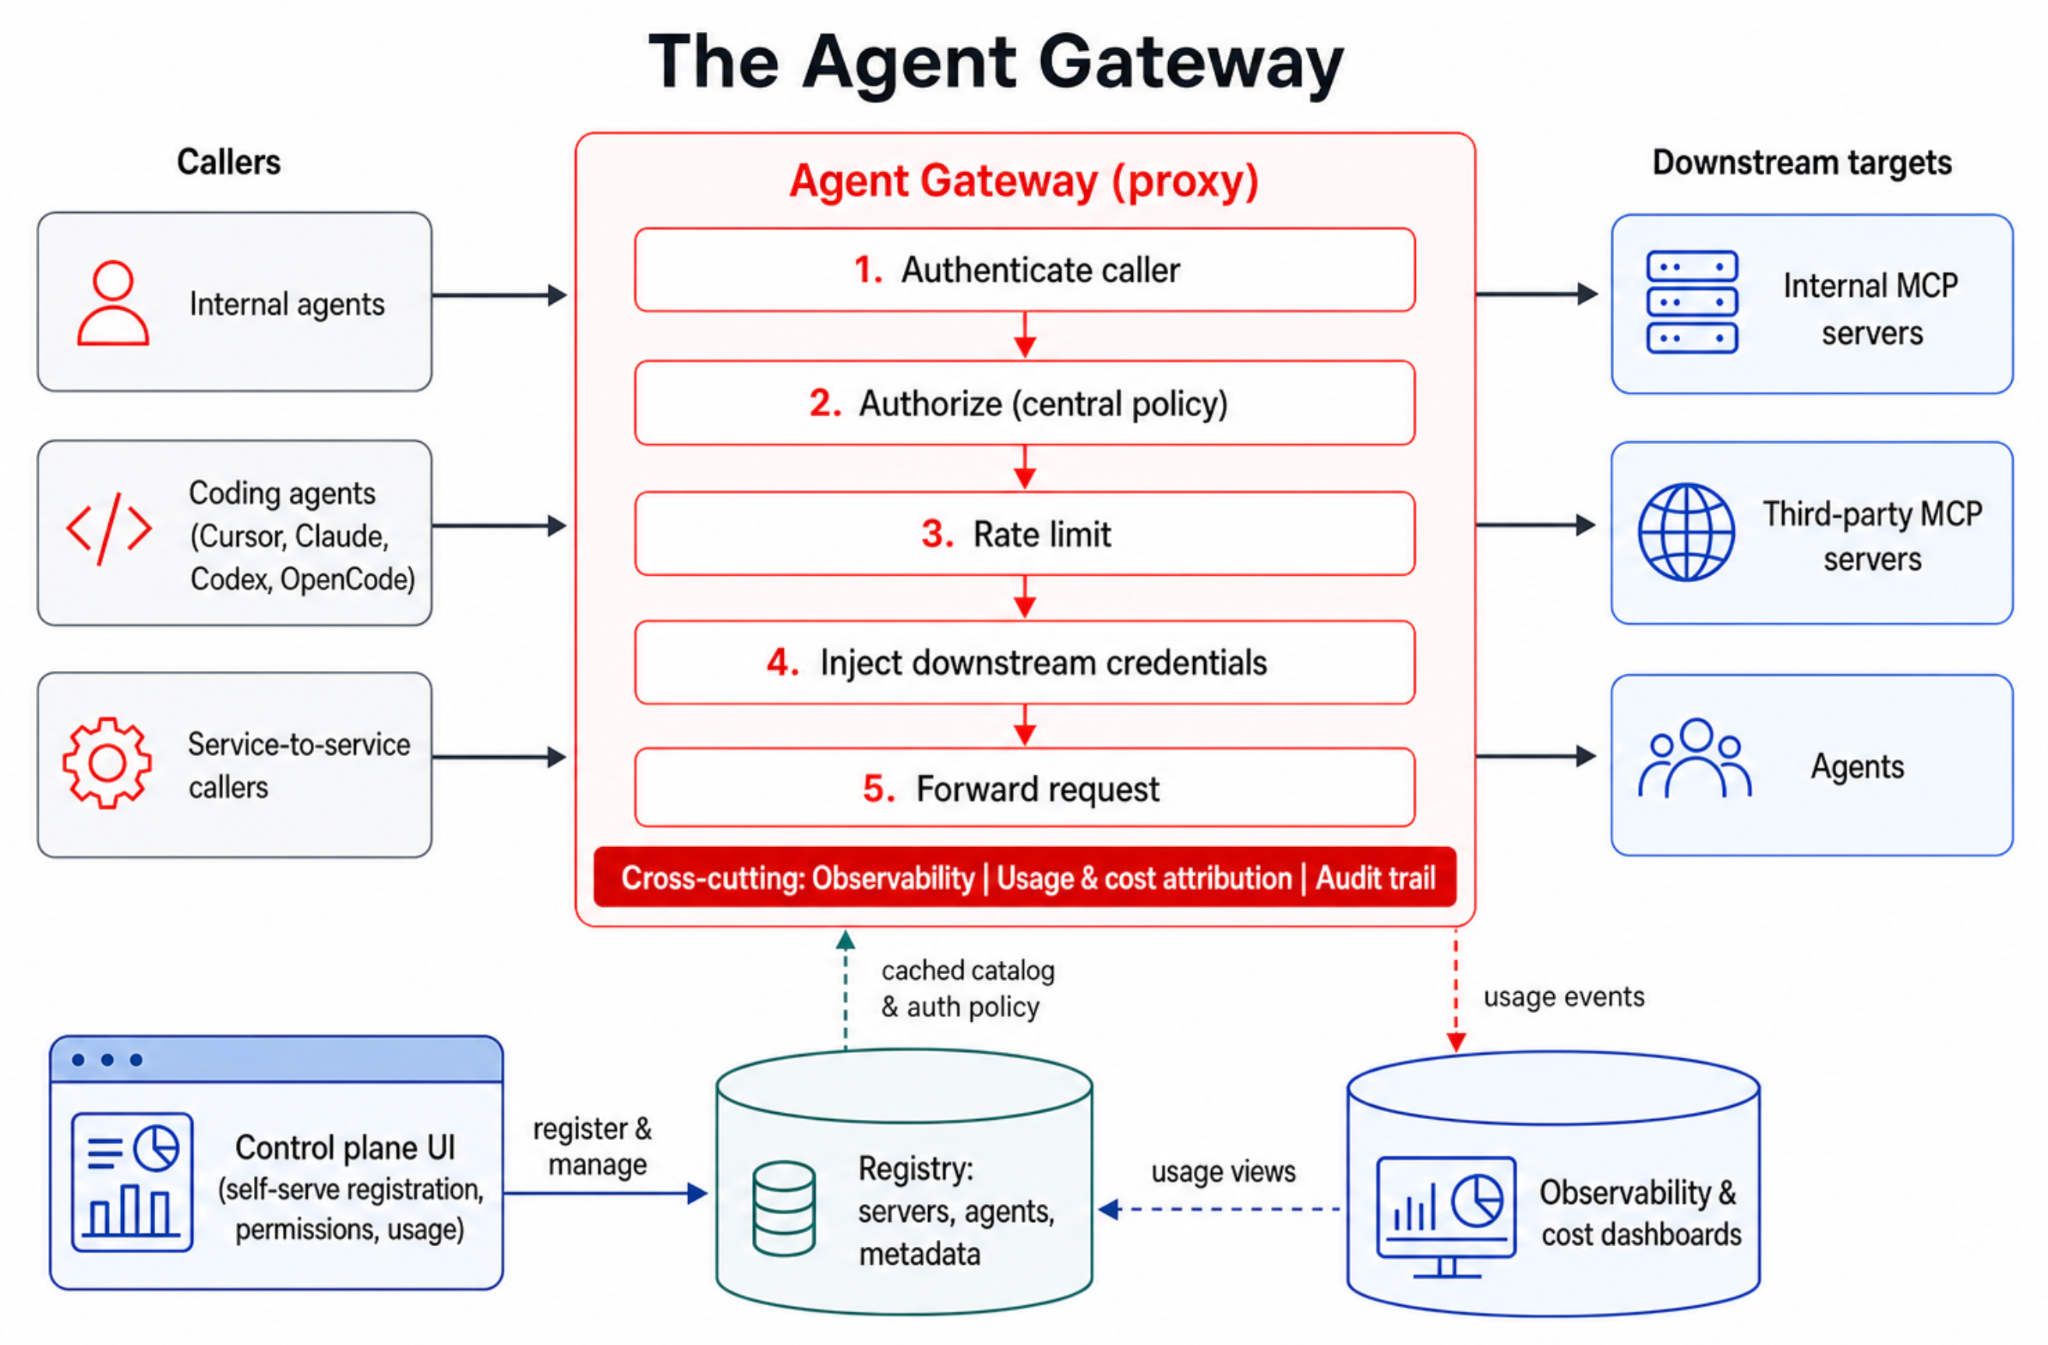
The gateway has two core pieces: a proxy and a registry, as shown in Figure 1 below. The proxy is the data plane; it receives each MCP request, authenticates the caller, authorizes the action, applies rate limits, injects credentials, forwards the request, and emits observability data. The registry is the control plane’s source of truth; it stores agents, MCP servers, owners, transport configurations, auth modes, policies, discovered tool catalogs, and tool-surface configurations.

Figure 1: High Level Architecture of Agent Gateway

This split gives the gateway a few properties that are hard to get from point-to-point integrations:

  • Agents use one consistent MCP endpoint pattern instead of learning every downstream server’s auth and routing model.
  • Tool owners register capabilities once, attach ownership and policy, and see production usage.
  • Security teams get one place to enforce access, revoke grants, and audit calls.
  • Platform teams can improve the shared path once and have every agent inherit the improvement.

We also keep internal and external trust boundaries separate. Internal DoorDash workflows and external-facing agentic use cases run through separate proxy planes with shared libraries and registry concepts. That contains the internet-facing blast radius and lets each auth model evolve independently.

Centralized identity, authorization, and secrets

Every gateway request resolves to a caller: a user, a service, or an agent acting with delegated user context. That identity is carried through authorization, credential injection, routing, and observability so every downstream action can be attributed.

The gateway checks authorization centrally. The policy questions do not stop with whether  this caller can access this server. They may also be:

  • Can this agent access this server?
  • Can this user call this tool through this agent?
  • Can this tool be exposed in this environment?
  • Can this caller use a write-capable variant, or only a read-only one?
  • Can this workflow use a team service principal, or does it require per-user OAuth?

Because policy lives in the gateway, DoorDash has a single place to change access and revoke it. Tool owners avoid rebuilding authorization for every server, and agent builders avoid encoding security decisions in prompts or application code.

Credential handling follows the same pattern, as shown in Table 1:

Auth modeWho holds the credentialWhat the gateway does
Internal service identityDoorDash infrastructureForwards verified caller context to internal services
Gateway-held tokenGateway secret storageInjects a vendor or service token without exposing it to the agent
Per-user OAuthEncrypted per-user grant storeInjects and refreshes the user’s token for user-scoped actions
Service principalGateway-managed team principalMints or brokers short-lived non-personal credentials

Agents should not hold raw credentials, such as vendor API keys, OAuth refresh tokens, or borrowed human grants for team automations. The gateway keeps those boundaries explicit and auditable.

Per-user OAuth without breaking the agent turn

User-scoped third-party tools need user authorization. Reading a user’s docs, filing a ticket as that user, or updating SaaS data on their behalf cannot safely use a shared key. Before we deployed the gateway, each team tended to build its own OAuth flow, token storage, and “go connect first” experience.

The gateway centralizes the OAuth grant. The unit of access is scoped to the agent, user, and server. On the first call that requires authorization, the gateway starts the provider’s OAuth flow, stores the resulting access and refresh encrypted tokens, and injects the user’s token on future calls. Agents never see the raw token.

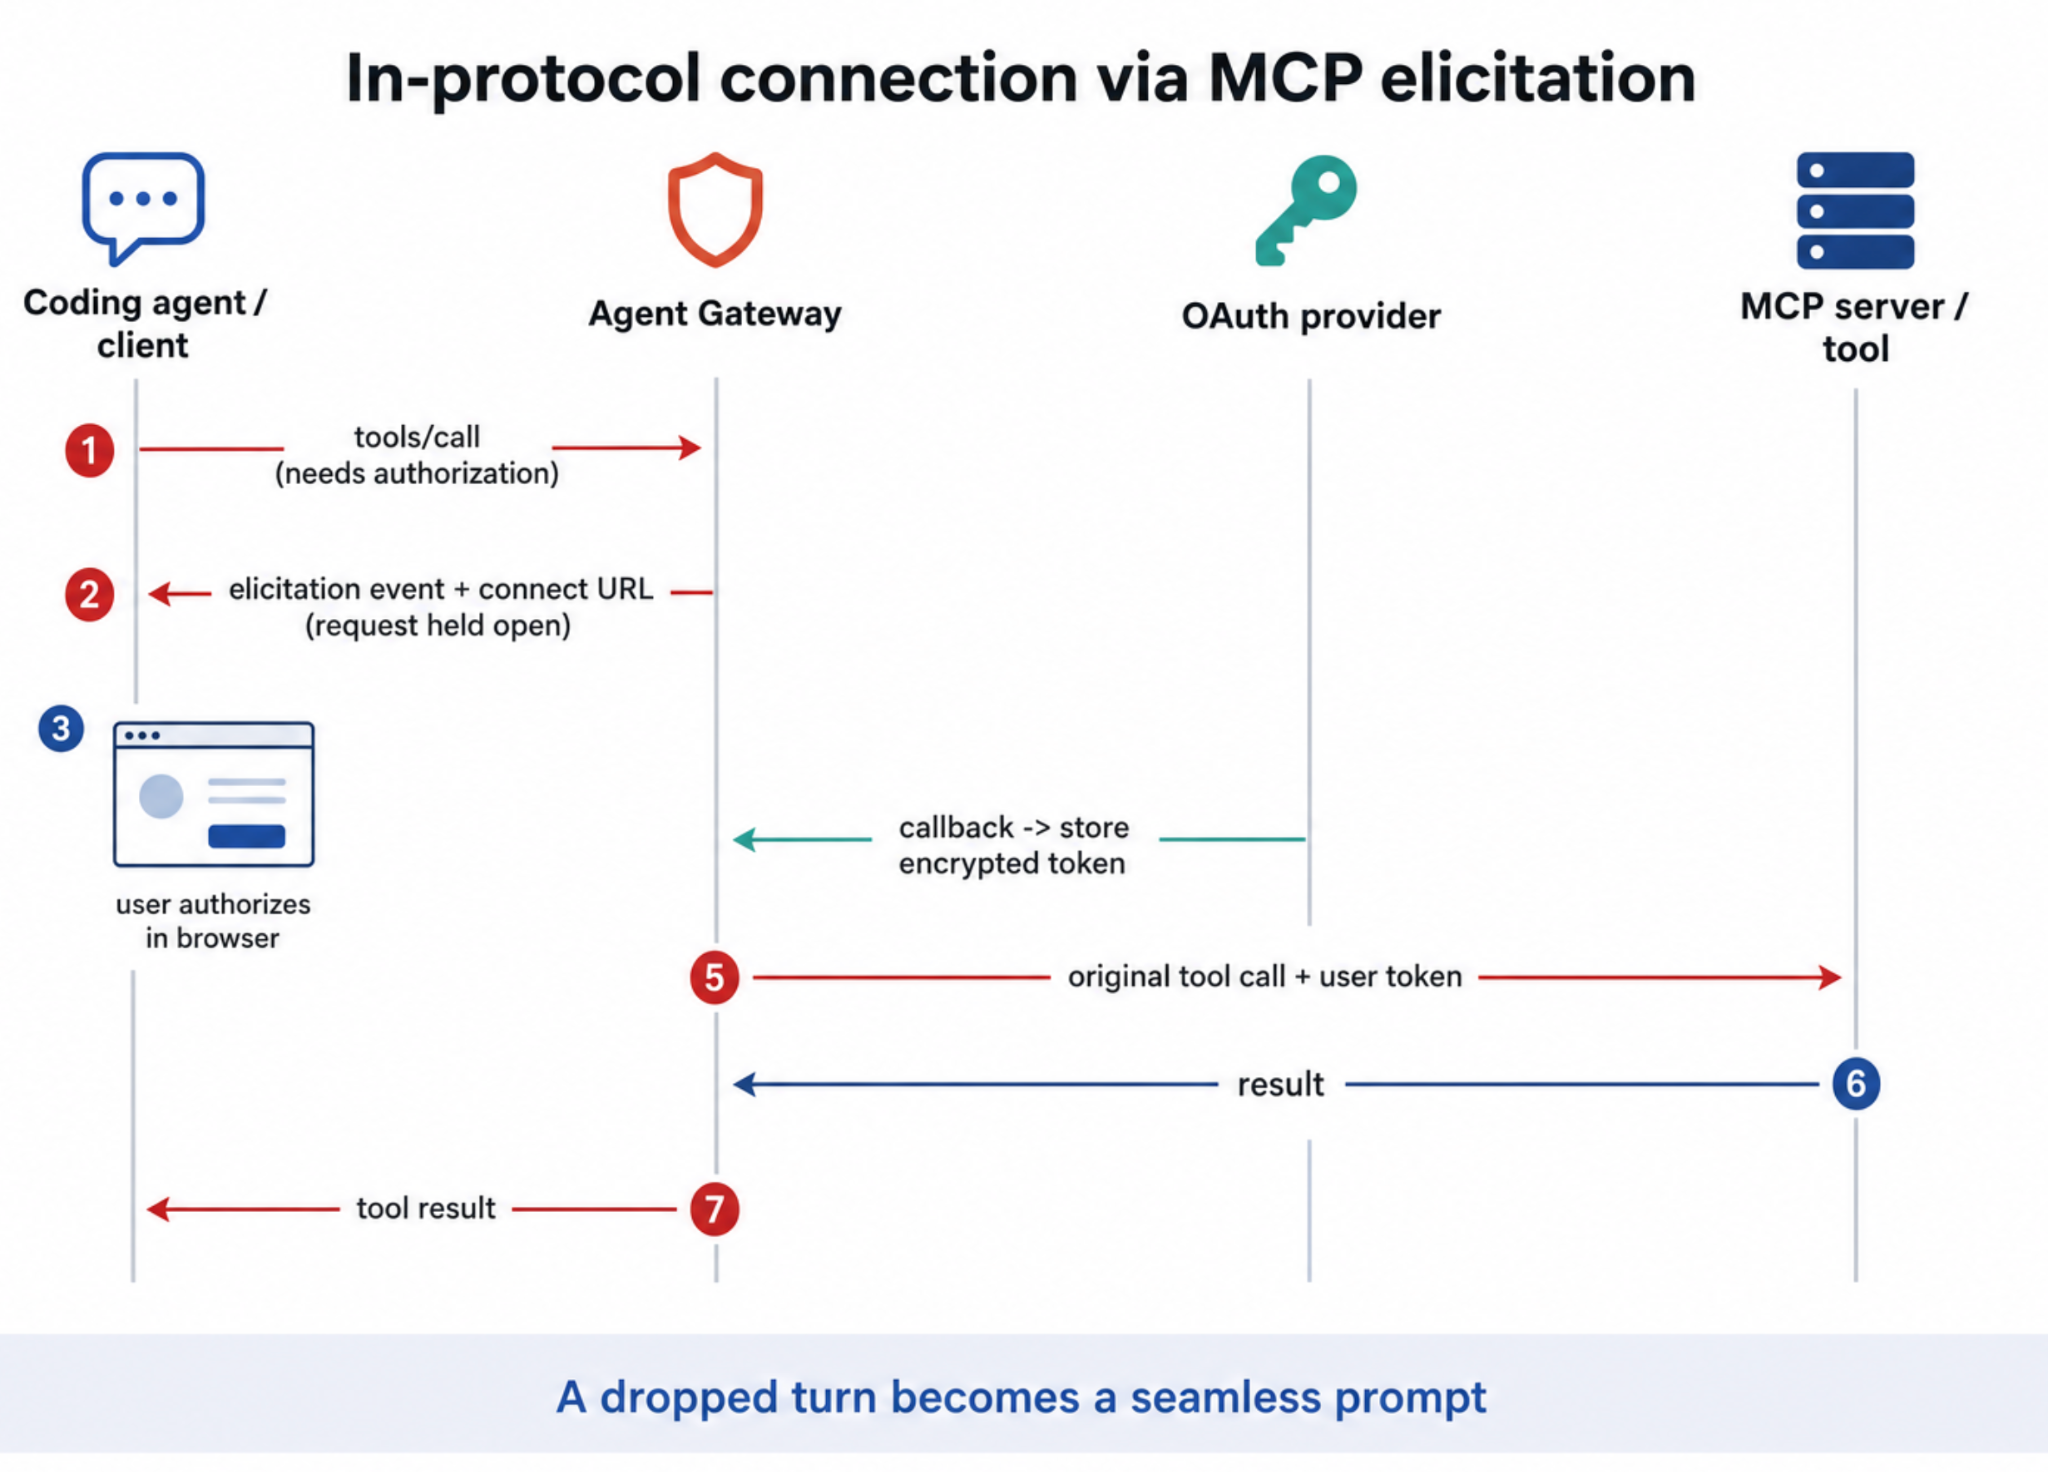
For clients that support MCP elicitation, the gateway can pause the tool call, ask the client to show a connection prompt, and resume the original call after the user authorizes it. For clients without elicitation support, it returns a structured authorization-required response with a connecting URL, as shown in Figure 2. This turns connection from a failed turn into a recoverable part of the tool call.

Figure 2: Elicitation handshake

Curated tool surfaces: Bundles and filtering

Agents do not naturally think in MCP servers. They think in tasks. A coding agent does not want GitHub, Jira, observability, and docs as separate setup steps; it wants the tool surface needed to investigate an issue, modify code, open a pull request, inspect CI, and understand production behavior.

At the same time, most downstream MCP servers expose far more tools than any one agent should use. Third-party servers may publish hundreds of operations, including admin actions, destructive actions, billing APIs, and niche provider-specific features. Most DoorDash workflows need only a small approved subset of these.

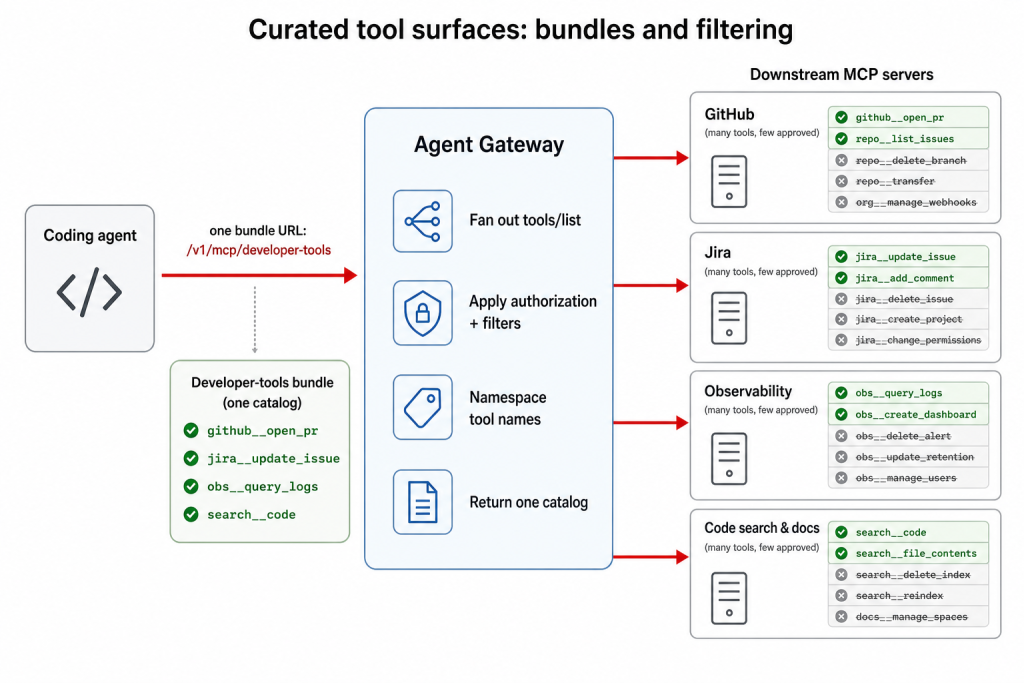
The gateway solves both problems with curated tool surfaces, as shown in Figure 3. Bundles combine tools from multiple MCP servers into one logical MCP endpoint. Filters decide which tools from each server are exposed for a given bundle, agent, user group, environment, or audience.

For example, a developer-tools bundle can include:

  • selected GitHub tools for repository and pull-request workflows;
  • selected Jira tools for issue lookup and updates;
  • selected observability tools for logs, metrics, and traces;
  • selected code-search and documentation tools; and
  • selected deployment or feature-flag tools.

Figure 3: User experience with bundled MCP pack

The agent connects to one gateway URL, such as a developer-tools endpoint. Behind that URL, the gateway fans out tools/list across the servers in the bundle, applies authorization and tool filters, namespaces or aliases tool names where needed, and returns one coherent catalog. When the agent invokes tools/call, the gateway enforces policy again, routes the call to the correct downstream server, and applies that server’s credential model.

This gives agents a product-quality interface instead of a raw dump of downstream capabilities, and includes such things as approved tools, stable names, clearer descriptions, ownership metadata, and audience-specific bundles. Engineering, data analysis, support operations, and external bundles can all use the same gateway primitives while exposing different tool surfaces.

The benefits are practical:

  • Agent setup is simpler: One gateway endpoint instead of many server endpoints.
  • Tool discovery is safer: Agents only see tools inside the approved boundary.
  • Model behavior improves: Smaller catalogs reduce irrelevant choices and tool confusion.
  • Authorization stays centralized: Discovery and invocation enforce the same policy.

This is where the gateway becomes more than an access proxy. It shapes what agents can discover, what they can call, and how much irrelevant context they carry. A curated tool surface can be the difference between an agent that picks the right tool and one that wanders through an oversized API catalog.

Observability, cost attribution, and downstream protection

Because every call flows through the gateway, each request can emit a structured event with:

  • the server, tool, bundle, and owning team;
  • the user, agent, service, and platform involved in the call;
  • authorization result, status code, error source, and latency breakdown;
  • request and response size; and
  • downstream-reported cost metadata when available.

The gateway also emits metrics for request volume, per-tool latency, authorization decisions, OAuth refresh outcomes, rate-limit decisions, streaming connections, and upstream failures. Trace propagation lets teams follow a call from the agent through the gateway to the downstream server.

This has direct operational value; security can audit access, platform teams can find noisy agents, tool owners can see adoption and errors, and infrastructure teams can attribute cost.

The same point protects downstream systems. Rate limits can be scoped by server, tool, caller, user, bundle, or caller type. New limits can run in shadow mode before enforcement, showing what would have been rejected without breaking production traffic.

The gateway turns governance into data instead of relying on every team to log the right fields and enforce the right limits.

Self-serve onboarding

A gateway only works if teams prefer to use it rather than bypass it. Registration, discovery, filtering, and bundle management all must be self-serve.

Through the control-plane UI and API, teams can register MCP servers and agents, configure auth, discover tools, attach ownership, define filters, add tools to bundles, and inspect production usage.

The onboarding loop for the gateway follows these steps:

  1. Register the MCP server.
  2. Discover its raw tool catalog through tools/list.
  3. Select and approve the tools DoorDash wants to expose.
  4. Attach auth mode, ownership, and policy.
  5. Add the approved tools to one or more bundles.
  6. Watch traffic, latency, errors, authorization decisions, and cost.

Governance that requires tickets does not scale. The paved road has to be easier than copying a secret into an agent and connecting directly to a server.

What changed

The gateway gives each group a different benefit:

  • Agent builders get one integration, one curated catalog, and no downstream auth, OAuth, secret handling, or per-tool routing.
  • Tool owners get a managed distribution path with access control, approved tool exposure, and production usage data.
  • Security teams get centralized policy, secrets, OAuth grants, revocation, and audit trails.
  • Platform teams get leverage; identity, rate limiting, observability, tool quality, cost attribution, and builder experience all improve in one place.
  • Agents get smaller catalogs, clearer tool names, task-oriented bundles, fewer irrelevant choices, and recoverable connection flows.

Adoption

Adoption is the real test of a platform: teams only route through it if it’s easier than going direct. By that measure, the Agent Gateway has become the default path for agent–tool access across DoorDash engineering:

  • More than 200 MCP servers are registered behind the gateway, together exposing thousands of tools curated into approved, task-scoped subsets rather than raw catalogs.
  • More than 30 agents and services, used by thousands of employees, reach those tools through the gateway and none of them handle raw credentials. 
  • Millions of tool calls every week are routed through the Agent Gateway, with each one authenticated, authorized, and recorded as a structured usage event.
  • Onboarding is self-serve and fast. Registering a new MCP server and its tools takes minutes, and pointing an agent at an already-registered tool is even faster.

Lessons learned

Building and scaling the gateway reshaped how we think about agent–tool access. A few lessons stand out, not just at DoorDash:

  • MCP solves invocation, not governance. Identity, policy, secrets, curation, observability, and revocation become the hard parts.
  • The discovered tool catalog is an interface, which means that names, descriptions, filtering, grouping, and audience matter.
  • Bundles are the right unit for workflows. Agents need task-oriented toolkits, not server lists.
  • Tool filtering improves both security and agent quality by exposing a smaller, clearer set of actions.
  • Credentials belong in the gateway, where they can be rotated, audited, and revoked centrally.
  • Missing OAuth grants are normal states, not exceptions, handling connection inside the protocol.
  • The governed path must be self-serve or teams instead will go direct.

What’s next

The next major investment will be in stronger agent identity and user delegation. The target model gives every agent a cryptographic identity and lets the gateway mint short-lived delegated credentials scoped to the user, agent, task, and target tool. That gives the audit trail two real principals: the user and the agent.

We are also investing in builder tooling, including quality and security report cards, checks for risky tool descriptions, detection of secrets or personally identifiable information in errors, scaffolded server creation, automatic registration, dynamic tool discovery, and redacted tool-call event streams for analytics and compliance.

Dynamic discovery continues the same theme. Instead of giving an agent every tool in a bundle, the gateway can use task context, policy, and usage signals to surface only the tools likely to be useful for the current job.

Conclusion

The Agent Gateway turns agent-tool access from repeated integration work into a shared platform capability. MCP made it easier to describe and invoke tools; the gateway makes that access governed, curated, observable, and scalable.

Acknowledgements

Introduction

We built Ask DoorDash on a common platform that lets domain teams build and evolve their agents without rebuilding the systems beneath them. We judged the platform by two practical outcomes: how quickly teams could add features and domains, and how quickly they could evaluate and release improvements to cost, quality, and latency.

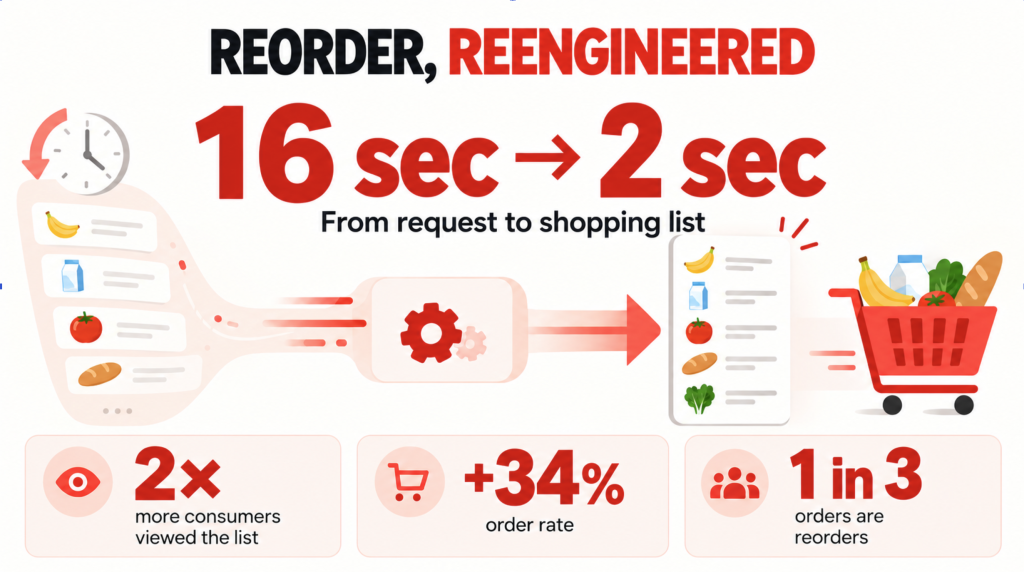
We launched Ask DoorDash with Restaurant and Grocery support in roughly two months, and it has since handled more than two million conversations. Adding Reservations, our third domain agent, took one week, roughly 10x faster than building the initial domain agents.

Our shared evaluation harness and rollout controls give teams clear quality signals as they move changes into production. Within a week of a new LLM’s release, we evaluated and deployed it, cutting p50 turn latency by 35% with no drop in quality scores. A subsequent model upgrade cut p50 turn latency by another 40%.

This post explains how we chose what belonged in the platform, how its components fit together, and the tradeoffs behind those decisions. It follows our engineering overview, our deep dive on intelligence, and our deep dive on evaluation. A deep dive on user experience will follow.

How we chose what to standardize

We centralized a capability only when multiple domains needed it and separate implementations would create reliability or operational problems. Orchestration, memory, model access, tracing, evaluation infrastructure, and rollout controls met that bar. Domain teams retained ownership of the instructions, skills, tools, evaluation criteria, and model choices that define their agents.

Where a suitable industry standard existed, we adopted it. Agent2Agent (A2A) defined how agents communicate, while Google Agent Development Kit (ADK) provided the framework for building and running them. These standards sometimes limited our design choices, but they gave teams shared contracts and saved us from developing proprietary equivalents.

For recurring problems without a suitable standard, we built the capability ourselves. A regression in shared code could affect several agents, so evaluation and rollout controls were mandatory. Every shared change had to pass common quality checks and release safeguards.

Ask DoorDash architecture

The central architectural decision was what every agent should share and what each domain should own. We built a shared execution path around specialized, domain-owned agents. A single general-purpose agent would grow harder to reason about as it took on more responsibilities, while fully independent agent stacks would duplicate infrastructure and produce inconsistent experiences.

As Figure 1 shows, each request enters through the Gateway. The Gateway authenticates the user, assembles entry-point context, and translates between the client’s HTTP and streaming interfaces and the platform’s A2A protocol. It then passes the request to the Orchestrator, which chooses the domain agent for each turn while preserving continuity as the conversation moves between domains. The selected agent loads the appropriate skills and uses Model Context Protocol (MCP) tools to interact with existing DoorDash services.

Below that request path, the platform provides session state, memory, artifacts, model access, tracing, evaluation infrastructure, and rollout controls. Domain agents use these common services while retaining control of their instructions, skills, tools, and evaluation criteria.

Figure 1: Ask DoorDash separates domain-specific agent behavior from the shared execution and production capabilities used across the system.

A Gateway for responsive, multimodal experiences

DoorDash client gateways were built for APIs that return a complete response quickly. Agents work differently. The first text may be ready while the agent is still calling tools, and the final response may combine prose with interactive store or item cards. We needed to stream that work without teaching every client how agents communicate.

The Gateway handles this translation. It authenticates the user, adds context about where the conversation started, and converts client HTTP requests into A2A requests. On the return path, it uses the Vercel AI SDK to send text updates and widget payloads to clients over Server-Sent Events (SSE). Clients render the updates as they arrive, so users can see progress while the agent completes the turn.

Building and operating the Gateway took work, but it concentrated work that would otherwise be duplicated across every DoorDash client. Agents can change behind one stable client contract without requiring coordinated client releases. A new domain agent reuses the existing authentication and streaming path instead of integrating separately with each app.

One assistant, specialized domain agents

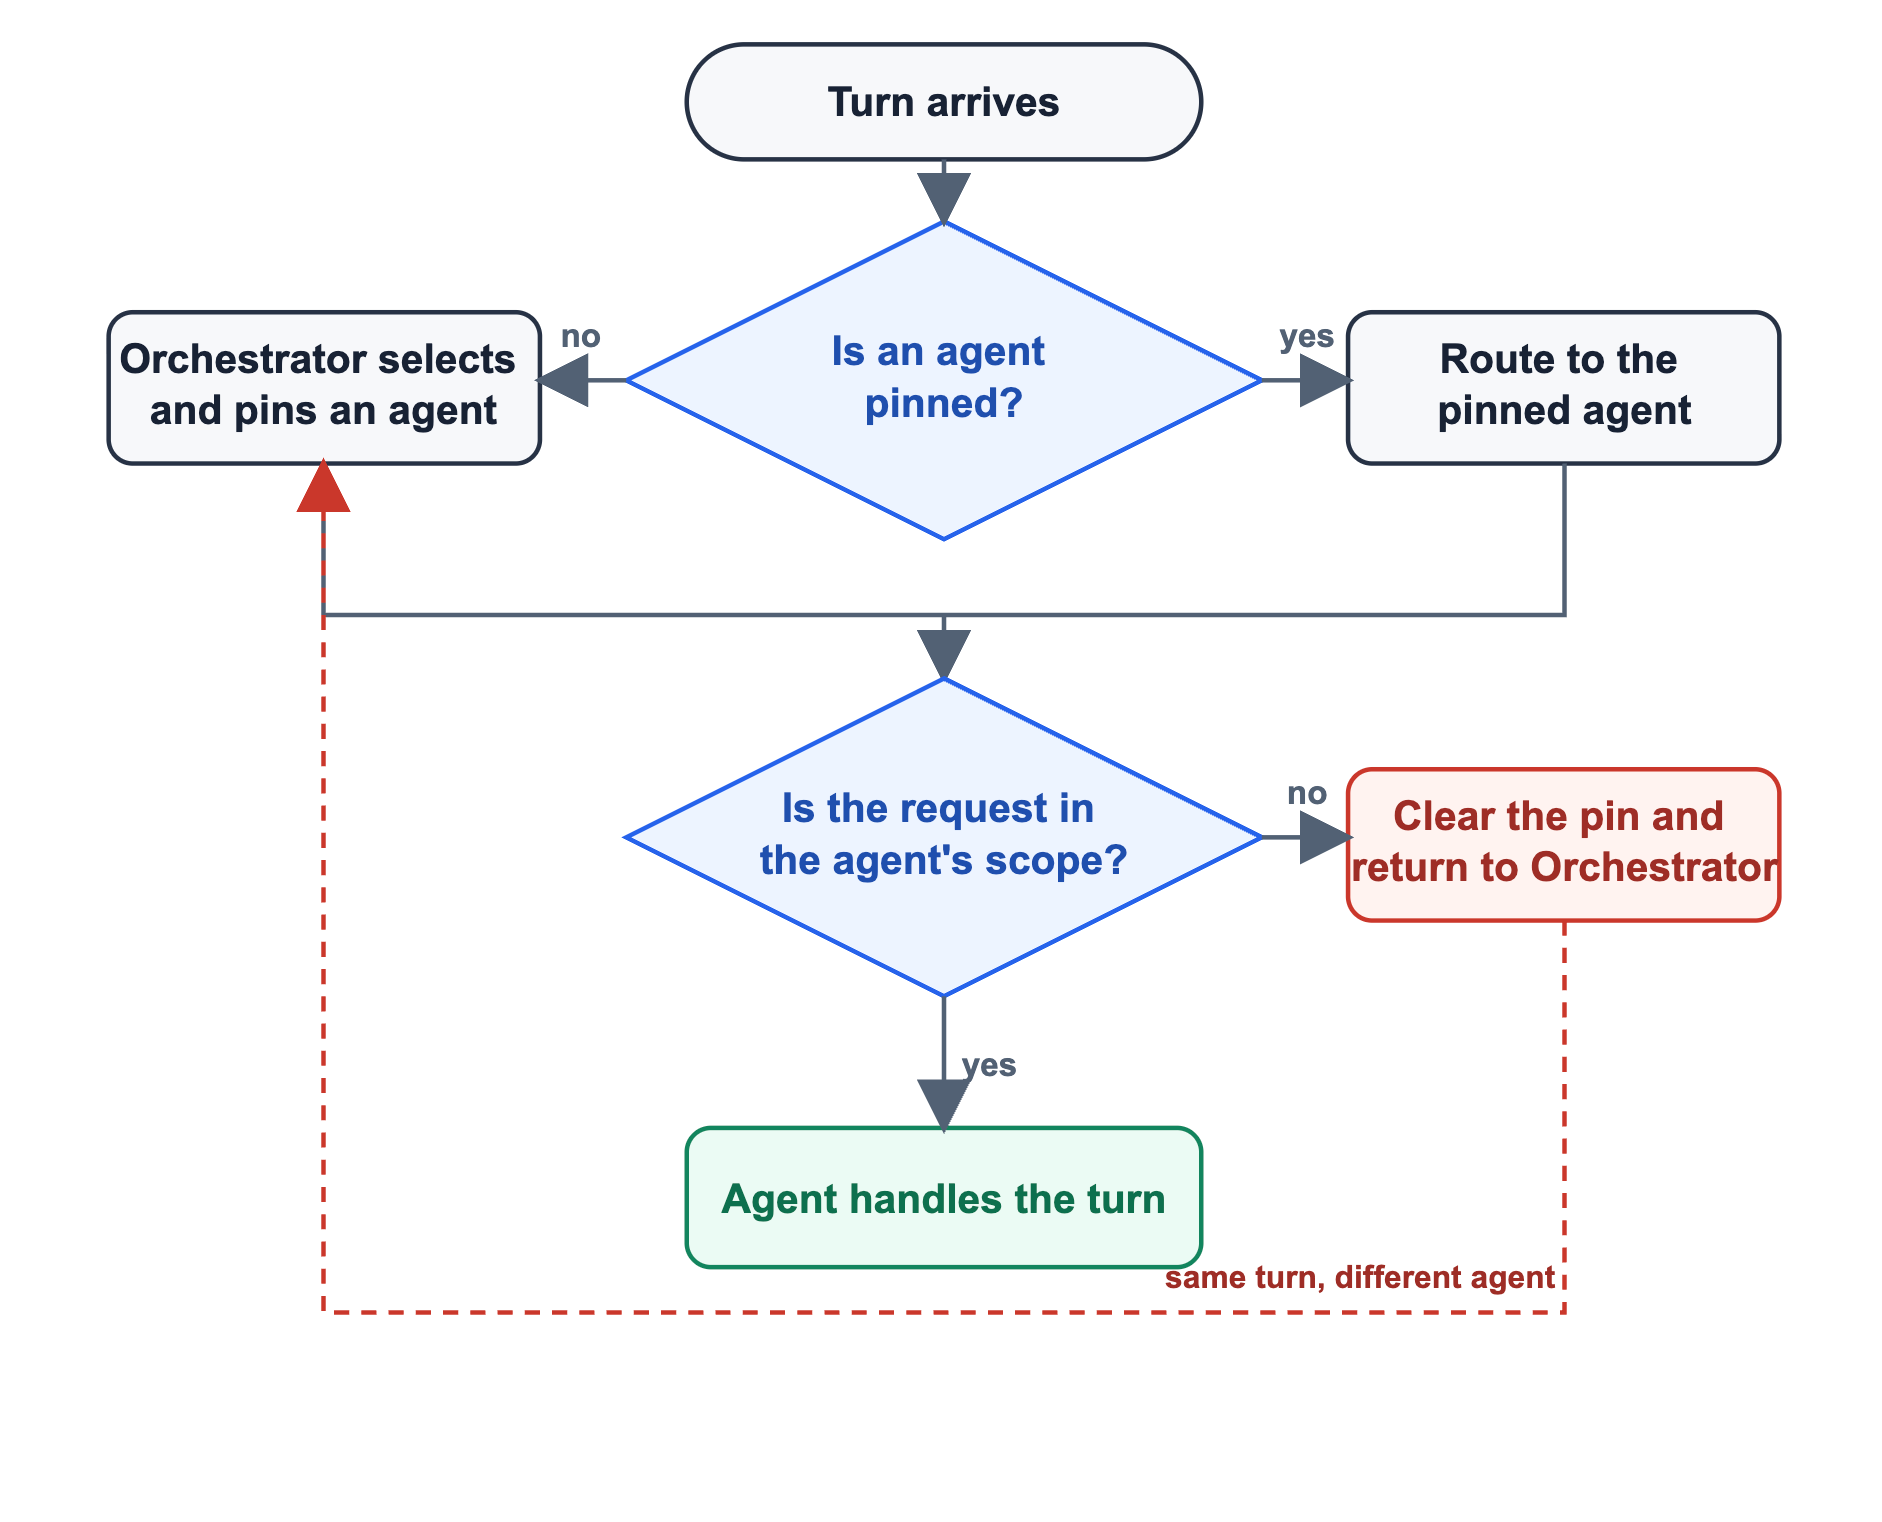
A conversation can cross domains without warning. A user might start with “I want chicken pot pie delivered in under 30 minutes,” then decide, “actually, I want to make it at home.” The first request belongs to the Restaurant domain and the second to the Grocery domain, but the experience needs to feel like one conversation.

We tried a single-agent architecture, but Restaurant, Grocery, and Reservations rely on different tools, policies, and evaluation criteria. Combining them would make the agent harder to test and force every domain onto the same release cycle. Each domain therefore owns a specialized agent. The Orchestrator reads the conversation and routes each turn to the appropriate agent over A2A.

That routing adds latency and input tokens, even when the conversation remains in the same domain. To reduce this cost, the Orchestrator pins follow-up turns to the selected domain agent. Pinning lets that agent handle subsequent requests directly, without another routing step. If the conversation changes direction, the domain agent recognizes the out-of-scope message and returns control to the Orchestrator. The Orchestrator reroutes the request within the same turn, hidden from the user.

Figure 2: Pinning avoids an Orchestrator call on follow-up turns while still allowing the conversation to move between domains.

Skills keep context and cost bounded

Specialized agents kept Restaurant, Grocery, and Reservations from sharing one enormous context window. As each agent gained capabilities, however, the same context problem appeared within individual domains. New features added instructions and tools to every turn, even when the turn never used them. That increased input-token cost, and overlapping or conflicting instructions confused the agent.

We added skill support to our harness to modularize instructions and tools. On each turn, the agent loads only what is relevant. A user might begin with, “find me a highly rated Thai restaurant that delivers in under 30 minutes,” then say, “show me the menu at the first one and add pad see ew to my cart.” Both requests stay with the Restaurant agent, but the first loads the search-discovery skill. The second loads the cart-ordering skill, which handles menu browsing and cart actions.

Dynamic loading adds a selection problem. The selector must recognize when a capability is needed without loading unrelated context too often, so we evaluate skill selection as part of the agent’s behavior. The added complexity was worthwhile because teams could add capabilities without expanding the context of every turn.

To measure the effect, we counted the tokens in the agent’s base and loaded skill instructions. We excluded conversation history, consumer messages, tool schemas, and tool results. The median skill-scoped turn used fewer than half as many instruction tokens as the monolithic system prompt.

AgentBase and skill instructions with all skills loadedMedian skill-scoped instructions per turnReduction
Restaurant~42,000 tokens

~20,000 tokens50%+
Grocery~25,000 tokens~10,000 tokens60%

Safe, reusable service access through MCP

Ask DoorDash needs access to DoorDash services to search for stores and items, read menus, manage carts, and act on a user’s behalf. The APIs behind these operations assume deterministic application code. An LLM choosing operations at runtime needs a narrower interface. Exposing the APIs directly would force the model to interpret low-level interfaces. Encoding permissions and business rules only in the prompt would add context without guaranteeing enforcement.

We built a shared Model Context Protocol (MCP) layer between the agents and DoorDash APIs. Each MCP tool exposes a focused operation with the inputs and outputs the model needs. The model chooses which tool to call. Deterministic code validates each request and enforces permissions and business rules before the call reaches the underlying service.

Prompts help the model choose the right operation, but that guidance is advisory. Validation and enforcement run in tool code on every call, creating a stable safety boundary as prompts and models change.

Tool design requires balance. A tool that is too broad can present the model with too many choices, while one that is too narrow can turn a task into a long chain of calls. Our shared MCP server now provides more than 60 tools across public and internal agent workflows. A new agent selects the tools it needs from that library, and improvements to validation, telemetry, or service integration benefit every agent that uses them.

Figure 3: Prompts influence what the model requests; MCP tool code determines what can execute.

Production readiness by default

ADK gave us the basic pieces for building an agent, including instructions, tools, callbacks, sessions, and model wiring. DoorDash agents also needed distributed tracing, model access, durable state, and rollout controls. Without a shared layer, each domain team would have to make those decisions and operate the resulting infrastructure independently.

We built reusable modules on top of ADK for capabilities that should work the same way across agents. Domain teams still choose their instructions, tools, and model configuration. The platform connects those choices to the systems required to run agents reliably in production.

Tracing is one example. A team enables it through configuration, and the shared SDK propagates a trace ID through A2A calls, MCP tools, and downstream DoorDash services. Engineers can follow one request across the Orchestrator, domain agents, and tool calls instead of piecing together logs from separate systems. The same trace data supports debugging and evaluation. Providing tracing through the platform saves roughly a month of observability work for each new agent launch.

Model access follows the same principle. Domain teams choose which models their agents use, while the platform standardizes how those models are invoked, traced, and protected by fallback behavior. Teams can evaluate and adopt new models without rewriting provider-specific integrations. That common path enabled the rapid model upgrades and latency improvements described earlier.

Shared state for reliable conversations

Earlier attempts at DoorDash agent products in 2025 showed how quickly the experience breaks down when state is unreliable. An agent could respond well to one request, then forget or misuse information from an earlier turn. Solving that problem required more than adding conversation history to the prompt.

Ask DoorDash uses three forms of state. Session state tracks the active conversation and work already completed within it. Memory preserves information that may be useful in later conversations, such as a user’s preferences. Artifacts hold structured outputs that agents create and update, including shopping lists and interactive cards. Each has a different lifetime and access pattern.

Earlier DoorDash agent projects implemented these capabilities independently. That duplicated persistence work and made reliability depend on each team’s choices. We centralized them in Managed Agent Services, which provides ADK-compatible APIs for sessions, memory, and artifacts. Domain agents use the same interfaces without operating their own stateful systems.

Centralizing state still requires separate storage and lifecycle rules for session data, long-term memory, and artifacts. Managed Agent Services keeps those boundaries in one place. Each domain still decides what information its experience should save and retrieve.

Managed Agent Services and the memory architecture are covered in more detail in Part Two.

Stay Informed with Weekly Updates

Subscribe to our Engineering blog to get regular updates on all the coolest projects our team is working on

What the platform changed

Reservations was a concrete test of the platform. The team reused the production path already serving Restaurant and Grocery and launched Reservations support in one week, roughly 10x faster than building the initial domain agents.

Domain teams keep ownership of agent behavior and quality criteria. The platform provides the evaluation harness, MCP tools, tracing, model access, and rollout controls, so improvements to those components reach every agent that uses them.

Shared infrastructure increases the blast radius of mistakes. A defect can affect several agents, and a premature abstraction can force different products into the same shape. We standardize a capability only after multiple domains need it and separate implementations would create reliability or operational problems.

Join Us

If building agent platforms and user-facing AI at scale sounds interesting, see our open engineering roles at careersatdoordash.com.

How we built a measurement layer that tells us where, why, and how much to trust an agentic code reviewer, and why a single metric never could.

In a nutshell

DoorDash recently described how we built a production code review agent that engineers actually listen to. That post covered the product and architecture choices behind the agent: a lead scout, deep reviewers, focused context, a precision-over-recall posture, and a model-agnostic design. DashBench is our measurement layer behind it. DashBench replays historical PRs and evaluates whether systems surface real, human-actionable findings instead of merely producing plausible comments. That distinction matters because convenient signals like acceptance rate, thumbs-up feedback, or a single aggregate score can make a reviewer look useful while hiding where it fails: missing important issues, over-indexing on easy comments, or trading recall for precision in ways product metrics do not expose.

The headline result: on the 105-case report, DoorDash’s production code reviewer (Claude Sonnet 4.6 high scout + Claude Opus 4.8 high reviewer) found 504 real findings with 53.6% weighted recall, compared with 164 real findings and 30.7% weighted recall for a no-scout GPT 5.5 high baseline. The broader model-mix view is more interesting than a single winner: Kimi K2.6 scout + Claude Fable 5 reviewer led weighted recall and F1, Composer 2.5 scout + GPT 5.5 medium reviewer led weighted precision, and the single-pass baselines stayed much cheaper.

Figure 1: Weighted precision/recall tradeoff
Figure 2: Weighted F1/cost tradeoff.

Note: Weighted metrics give more weight to higher-severity issues (critical = 4, high = 2, medium = 1, low = 0.5).

Why the obvious signals lie

The tempting way to measure a code reviewer – and the main metric most major code review tools use today – is to watch what happens in production: do authors accept its comments, do they act on them? That signal is real. But it’s built on a foundation of shaky assumptions and incomplete information. In the language of confusion matrices, acceptance only ever populates two of the four cells: a comment the author accepts is booked as a true positive (TP), one they reject as a false positive (FP). Both bookings assume the human’s call is ground truth – that engineers are infallible, or at least they’re wrong rarely and randomly enough that the errors don’t matter in aggregate. As we’ll see, that’s a bad bet. 

The other two cells stay empty, and that’s the real cost. Acceptance can’t record false negatives (bugs the reviewer missed) or true negatives (clean code where silence was the right answer). It tells you something happened; it doesn’t tell you whether the review was right, whether silence was justified, or what gets missed. DashBench handles that differently: after adjudication, missed real issue clusters count as false negatives for benchmark scoring, even though production acceptance telemetry cannot observe them.

The other problem alluded to above is that human acceptance is a useful signal, but not ground truth. Authors accept and reject comments for product and workflow reasons: timing, PR urgency, ownership context, how invasive the fix is, or whether the issue was already handled another way. That makes acceptance a valuable product telemetry, but a weak benchmark label by itself. In disagreement audits, human review and agentic verification both surfaced mistakes; the point was not to declare one side right, but to separate “was accepted” from “was real.” The most available metric can still point at the wrong target.

That’s the reason we built DashBench. If we lean on the convenient metric to build and improve a system our engineers now depend on, we would optimize confidently towards a foundationally flawed objective. The fix isn’t a better single metric. It’s a benchmark that triangulates across several flawed signals and never relies on any one of them as the ground truth. 

From a production architecture to a clean place to measure

Our production reviewer uses a staged architecture that separates noticing from verifying. A lead scout reads the change and flags suspicious areas. Deep reviewers then investigate the strongest leads, confirm whether each concern holds up, and drop the claims that don’t survive scrutiny. It mirrors how strong human reviewers work: form hunches, aim attention at the risky parts of the diff, then validate before asking an author to do anything.

That design happens to give us a clean evaluation surface. Because the workflow is model-agnostic, every component is a variable we can hold fixed or change on its own: the scout model, the reviewer model, the context policy, the tool policy, the runtime budget. We can replay the same frozen PRs through the production agent, through staged variants with different model assignments, and through plain single-pass reviewers, and the thing being measured stays constant.

So the useful question stops being “which model is best?” It becomes: for a given architecture, context policy, tool policy, runtime budget, and model mix, what tradeoff between coverage, precision, cost, and latency do we actually get, and where does it fail? “Best” is meaningless until you say best at what, on which cases, at what cost.

How we built the benchmark

Figure 3: DashBench benchmark pipeline

The important part is the loop, not any single box. New cases and model changes keep entering the same replay-and-score path, while disagreement review keeps the benchmark honest when human feedback, production behavior, and agentic judgment do not line up. In that pass, we manually inspect the evidence, decide whether the finding is real, and feed the resolved cases back into judge calibration. The judge itself is LLM-based, but DashBench treats it as a calibrated signal, not ground truth.

The cases.

DashBench started from roughly 1,000 raw PR candidates and was curated toward cases that stress different review behaviors, such as tricky diffs, noisy review histories, and varied severity outcomes. The post uses the 105-case valid report to analyze staged-versus-single-pass systems, scout/reviewer model choices, and severity-weighted quality on one consistent eval slice.

  • Historical PRs with real review findings and enough surrounding context to faithfully replay the review.
  • Benign PRs with close to zero real findings, so the benchmark can measure restraint and catch false positives; a reviewer that’s loud on clean code is its own failure mode.
  • PRs that were later reverted or hotfixed, so the benchmark can test whether a system catches genuine code-level regressions before merge.

The labels. 

This is where most benchmarks cut a corner we refused to. Preparing labels took more than importing human feedback. We had the engineers who wrote the PRs annotate candidate findings, then compared three sources against each other: the human annotations, the original candidate findings, and an agentic judge. Human feedback was valuable but frequently wrong: reviewers missed valid issues, accepted weak claims, or read a historical PR’s context differently than the next reviewer would. Where the three sources disagreed, we re-reviewed the evidence by hand and resolved it, and those resolved cases became calibration data for the judge.

The result is a benchmark whose ground truth doesn’t rest on any single fallible source. Human judgment, production feedback, and agentic evaluation each contribute; none is treated as infallible. 

The execution environment. 

Within a comparison, every configuration runs against the same frozen case set, context track, prompt and skill-pack selection, normalized output contract, and grading pipeline. The harness is part of what we are measuring: profiles differ in runner kind, scout/reviewer models, tool surface, context mechanics, and provider limits. Some run from a prepared repo with read/grep-style tools, some receive bounded repo context in the prompt, and some disable search or judge steps in the review run. Cost, latency, timeouts, retries, and failures are recorded in the run artifacts and suite summaries rather than treated as controlled constants. The point is repeatability: when a number moves, we want to know whether it moved because the model or harness changed, not because the eval drifted.

The Report: What DashBench actually shows

We use DashBench to answer four questions that production telemetry alone cannot answer. First, does staging actually buy coverage? Second, which scout/reviewer model choices change the cost, precision, and recall frontier? Third, do the headline rankings survive when we split findings by severity? Fourth, when do staged scout/reviewer setups beat stronger single-pass reviewers, and what do they give up to do it?

Staging benefits

Staging buys coverage, and the price is visible. On the 105-case report, DoorDash’s production code reviewer (Claude Sonnet 4.6 high scout + Claude Opus 4.8 high reviewer) found 504 real findings with 53.6% weighted recall, compared with 164 real findings and 30.7% weighted recall for the no-scout GPT 5.5 high baseline. Weighted precision stayed in the same neighborhood, 87.0% versus 84.1%, but the production reviewer cost more per PR and took longer. That is exactly the kind of result we want DashBench to surface: not a trophy, but a measured tradeoff.

SystemReal findingsWeighted precisionWeighted recallCost / PR
DoorDash production code reviewer50487.0%53.6%$3.91
No scout + GPT 5.5 high reviewer16484.1%30.7%$0.75
No scout + Claude Opus 4.8 high reviewer11589.8%20.2%$0.65

Scout/reviewer model choice

The model-mix comparison is where the benchmark becomes most useful: we swap which model scouts and which model reviews while keeping the benchmark fixed. No configuration dominates every axis. Kimi K2.6 scout + Claude Fable 5 reviewer had the strongest weighted recall and F1 on the 105-case valid subset, at 65.2% weighted recall and 75.3% weighted F1. Composer 2.5 scout + GPT 5.5 medium reviewer had the strongest weighted precision at 92.2%, but with materially lower recall. The no-scout baselines were cheaper, while Kimi K2.6 scout + Claude Opus 4.8 high reviewer was a lower-cost staged alternative with materially lower recall.

ConfigurationReal findingsWeighted precisionWeighted recallWeighted F1Cost / PR
Kimi K2.6 scout + Claude Fable 5 reviewer53789.2%65.2%75.3%$3.81
Claude Sonnet 4.6 high scout + Claude Opus 4.8 high reviewer50487.0%53.6%66.3%$3.91
Kimi K2.6 scout + Claude Opus 4.8 high reviewer39682.3%45.8%58.9%$2.35
Claude Sonnet 5 high scout + Claude Sonnet 5 high reviewer32177.3%40.1%52.8%$6.55
Claude Sonnet 5 high scout + Claude Opus 4.8 high reviewer22680.8%32.9%46.8%$5.06
GPT 5.5 medium scout + GPT 5.5 high reviewer27691.5%19.9%32.6%$5.95
Composer 2.5 scout + GPT 5.5 high reviewer26791.1%19.6%32.2%$4.68
Composer 2.5 scout + GPT 5.5 medium reviewer24692.2%18.0%30.1%$3.53
No scout + GPT 5.5 high reviewer16484.1%30.7%45.0%$0.75
No scout + Claude Opus 4.8 high reviewer11589.8%20.2%33.0%$0.65

Impact of severity of findings on evaluation

Severity changes the story again. Across the 105-case valid subset, the union of adjudicated real findings contains 40 critical, 136 high, 271 medium, and 385 low clusters. Kimi K2.6 scout + Claude Fable 5 reviewer was strongest on critical, high, and medium coverage, while Claude Sonnet 4.6 high scout + Claude Opus 4.8 high reviewer covered slightly more of the low-severity tail. The no-scout GPT 5.5 high row was cheap and still useful on high-severity issues, but weaker on overall coverage. This is why the weighted score exists: it gives critical and high-severity misses more pull than low-severity misses, while still letting us inspect the full severity split.

Figure 4: Recall by severity.

The severity view shows why one score is not enough: configurations that look close overall miss very different kinds of issues.

Influence of model quality and size on benchmark results

The model-mix data says the same thing in numbers: Kimi K2.6 scout + Claude Fable 5 reviewer leads weighted recall and F1, Composer 2.5 scout + GPT 5.5 medium reviewer leads weighted precision, and the single-pass no-scout baselines stay cheaper while giving up coverage. Purpose-built staging does not make a weaker model magically best at everything; it changes the shape of the tradeoff. Scouts improve breadth when the reviewer can verify aggressively. Stricter reviewer configurations improve precision when the business goal is to reduce noise. Single-pass no-scout baselines are a useful lower-cost floor, but they leave coverage on the table. The result is not that one model wins. The result is that no single configuration dominates, and being able to say exactly that is the point.

Lessons from benchmarking PR reviewing

Trust must be earned. No single signal is a reliable source of truth for real-world benchmarking. Human labels, production acceptance, and agentic judgment each contributed, and each was wrong often enough that treating any one as ground truth would have quietly poisoned the scores. The benchmark is only as good as its refusal to trust any fallible input alone.

Humans don’t scale. Human attention for labeling degrades fast on complex tasks, and faster across many of them, even when the labeler is the same engineer who wrote or reviewed the original PR. AI judging is what makes labeling at this scale tractable at all, but only under the constraints in the next two lessons.

Variance is a feature, not a bug. LLMs are non-deterministic, so multiple runs of the same agent surface additional valid findings, meaning a single run understates an agent’s real coverage, and you have to run repeatedly and aggregate to score it honestly. The same stochasticity applies to the judge: deterministic matching is stable but misses semantic equivalence, while LLM judges reason more richly but need calibration, audit sets, and stable rubrics to stay trustworthy. The whole measurement stack is stochastic; the work is designing for that instead of pretending it away.

When one metric can’t work, look to many. A single score is misleading by construction. Weighted precision, weighted recall, weighted F1, not-real findings, high/critical recall, latency, and cost all move independently; a system can win one and lose another in the same run, so “better” is meaningless until you say better at what.

Stay Informed with Weekly Updates

Subscribe to our Engineering blog to get regular updates on all the coolest projects our team is working on
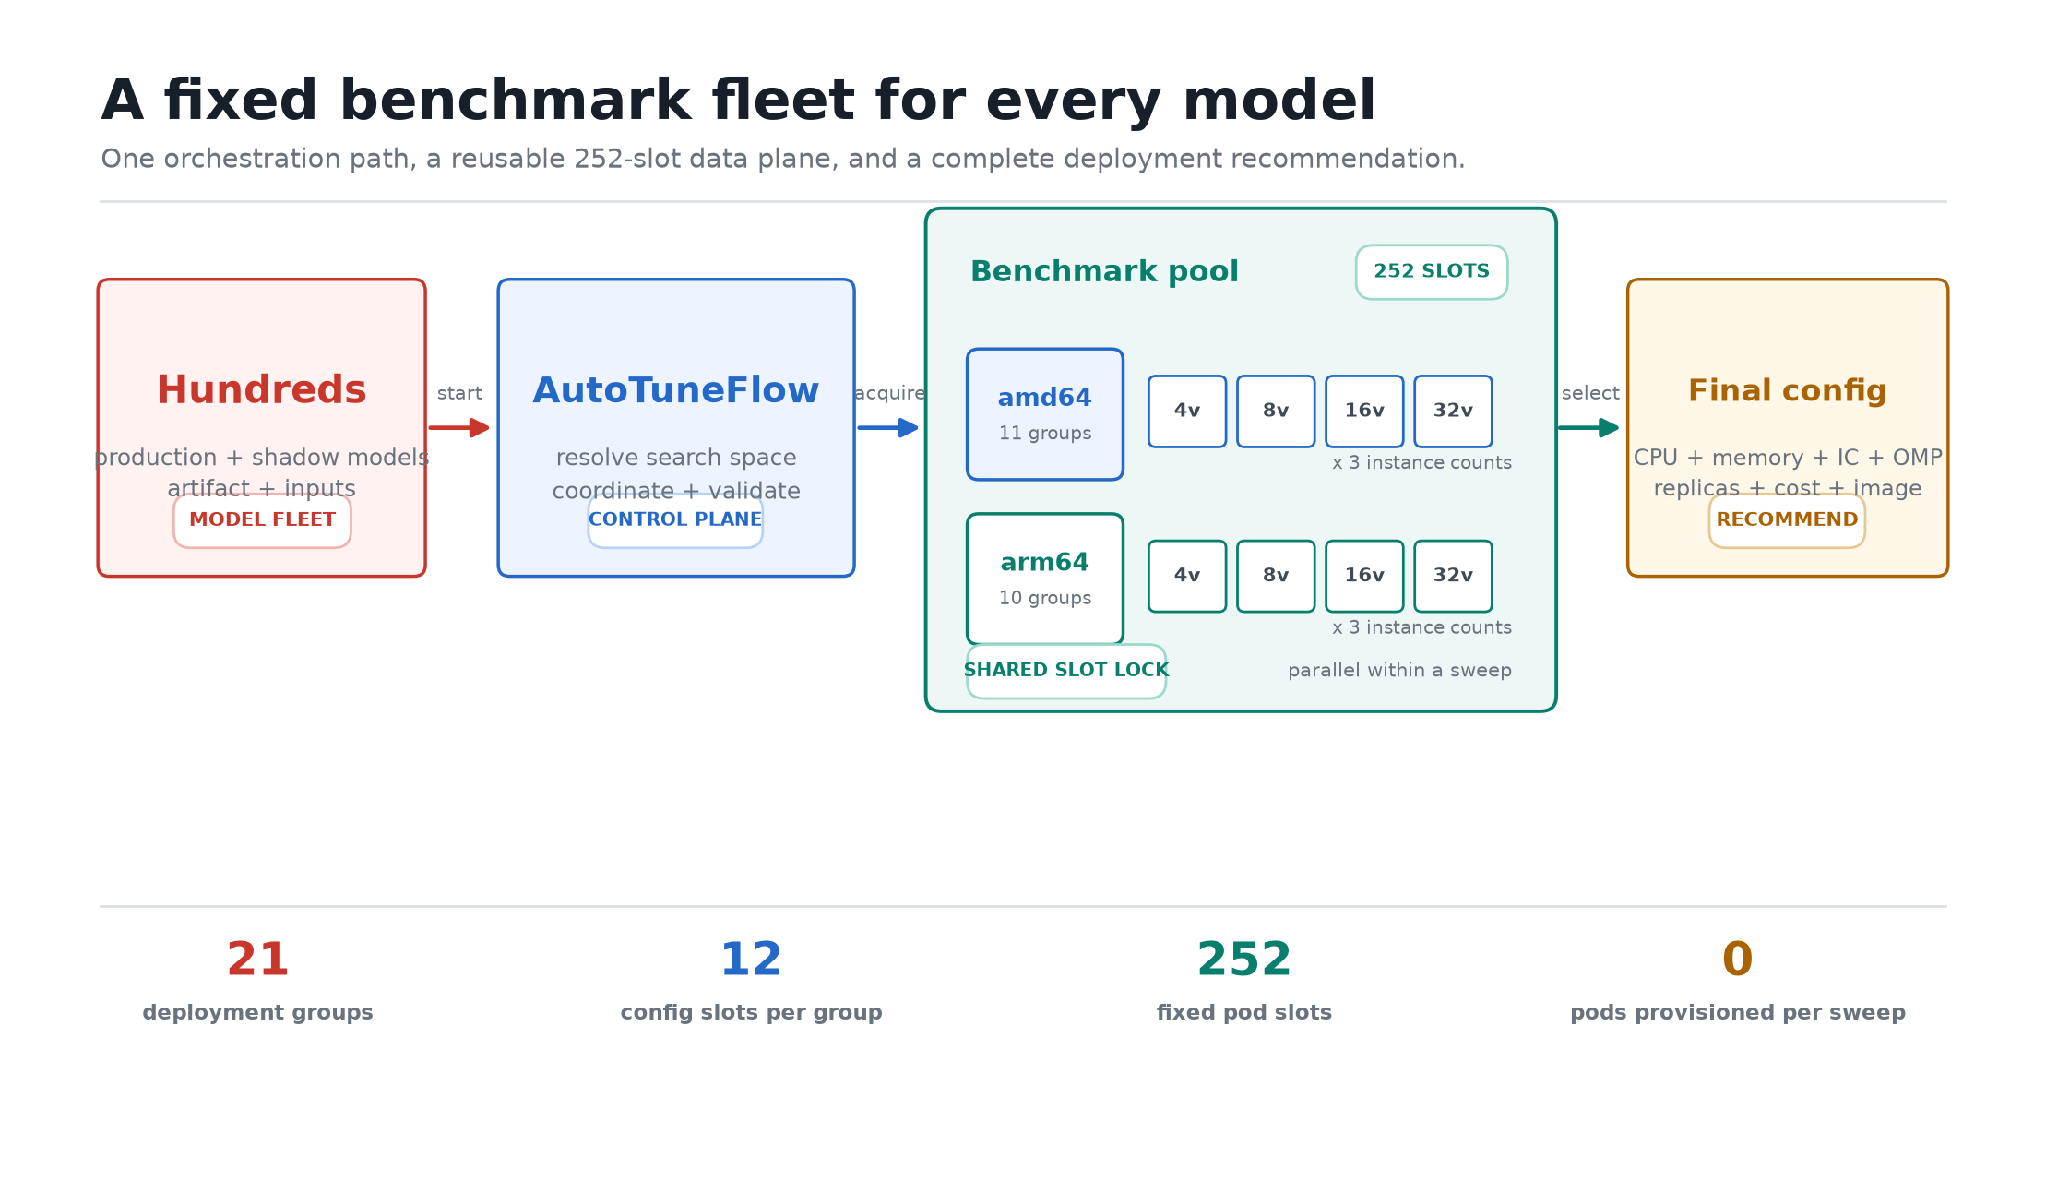
What’s next

DashBench exists so we can keep improving the reviewer with evidence instead of anecdotes. The goal was never a static leaderboard; it’s a feedback loop where every material change to model, prompt, context, tool use, workflow, or runtime budget gets tested the same real PR-review cases before it reaches an engineer.

The next stretch is continuous benchmarking:

  • New models and harnesses enter the benchmark quickly as they ship, including additional agent harnesses we have planned for this stage.
  • Stale PR cases retire from the dataset while new cases are added continuously, so the benchmark tracks the codebase instead of drifting away from it.
  • We’re moving from a single judge to an agentic jury, to mitigate bias between individual judge models.
  • We’re benchmarking against external code-review solutions, not just internal variants.

And we’re starting to benchmark coding agents, not just reviewers, on a real enterprise codebase with real tasks and features. More on that later.

The honest summary is this: making an AI system useful is only half the work. The harder part is knowing where it fails, why it fails, and whether the next change made it better or just different. Most of the field is still measuring the wrong unit with the wrong number. DashBench is our attempt to measure the work that actually matters: real findings, on real PRs, with the tradeoffs left visible. If that is the kind of problem you want to work on, we’d like to talk.


Appendix

Parking lot for detail that backs the post without slowing the body down. The Report section keeps the reader on the tradeoffs; this section keeps the audit trail.

A. Execution environment (full spec). Within a comparison, each configuration runs on the same dataset cut and produces the same structured finding contract: severity, evidence, and file anchors. The harness itself is part of what DashBench measures, so profiles can differ in runner kind, scout/reviewer split, model choice, tool surface, context mechanics, and provider limits. Scoring then uses the same matching path for that comparison, with deterministic matching where possible and agentic judging where semantic matching is needed. The point is not to erase system differences; it is to make those differences explicit enough that cost, latency, and quality move for interpretable reasons.

B. Dataset and eval-set sizes. DashBench started from roughly 1,000 raw PR candidates, then narrowed to cases that could be replayed and adjudicated. The post uses the 105-case valid report for the main model-mix and staged-versus-single-pass analysis. The severity denominator in that 105-case cut is the union of real finding clusters: 40 critical, 136 high, 271 medium, and 385 low. Those are finding clusters, not PR counts; one PR can contribute more than one cluster.

C. Full configuration metrics. The body shows the narrow version because that is the readable version. The full metrics are below for auditability, split so they stay on the page.

MetricDoorDash production code reviewerNo scout + GPT 5.5 high reviewer
SetupClaude Sonnet 4.6 high scout + Claude Opus 4.8 high reviewerSingle reviewer
Raw findings611200
Real findings504164
Weighted precision87.0%84.1%
Weighted recall53.6%30.7%
Weighted F166.3%45.0%
High/critical recall52.8%51.7%
Cost / PR$3.91$0.75
Cost / real finding$0.82$0.48
Review latency / PR725.0s170.3s
CaveatHigher cost and latency, but broader coverageLower cost and latency, but much lower overall recall

ConfigurationFindingsQualityCost / latency
Kimi K2.6 scout + Claude Fable 5 reviewer669 raw
537 real
132 not real
89.2% precision
65.2% recall
75.3% F1
$3.81 / PR
$0.75 / real
589.3s / PR
Best weighted recall/F1
Claude Sonnet 4.6 high scout + Claude Opus 4.8 high reviewer611 raw
504 real
107 not real
87.0% precision
53.6% recall
66.3% F1
$3.91 / PR
$0.82 / real
725.0s / PR
Kimi K2.6 scout + Claude Opus 4.8 high reviewer574 raw
396 real
178 not real
82.3% precision
45.8% recall
58.9% F1
$2.35 / PR
$0.62 / real
263.9s / PR
Fastest measured staged setup
Claude Sonnet 5 high scout + Claude Sonnet 5 high reviewer509 raw
321 real
187 not real
1 unclear
77.3% precision
40.1% recall
52.8% F1
$6.55 / PR
$2.14 / real
657.9s / PR
Claude Sonnet 5 high scout + Claude Opus 4.8 high reviewer327 raw
226 real
100 not real
1 unclear
80.8% precision
32.9% recall
46.8% F1
$5.06 / PR
$2.35 / real
565.3s / PR
GPT 5.5 medium scout + GPT 5.5 high reviewer332 raw
276 real
56 not real
91.5% precision
19.9% recall
32.6% F1
$5.95 / PR
$2.26 / real
619.5s / PR
Composer 2.5 scout + GPT 5.5 high reviewer324 raw
267 real
57 not real
91.1% precision
19.6% recall
32.2% F1
$4.68 / PR
$1.84 / real
539.2s / PR
Composer 2.5 scout + GPT 5.5 medium reviewer285 raw
246 real
39 not real
92.2% precision
18.0% recall
30.1% F1
$3.53 / PR
$1.50 / real
429.4s / PR
Best weighted precision
No scout + GPT 5.5 high reviewer200 raw
164 real
36 not real
84.1% precision
30.7% recall
45.0% F1
$0.75 / PR
$0.48 / real
170.3s / PR
No scout + Claude Opus 4.8 high reviewer134 raw
115 real
19 not real
89.8% precision
20.2% recall
33.0% F1
$0.65 / PR
$0.60 / real
112.8s / PR

D. Severity breakdown (full). The severity view is the clearest reason the weighted headline metric exists. Critical and high misses are not interchangeable with low-severity misses, and the configurations move differently by tier.

Recall by severity

SeverityUnion real clustersKimi K2.6 + Fable 5Sonnet 4.6 high + Opus 4.8 highKimi K2.6 + Opus 4.8 highGPT 5.5 high
Critical4080.0%62.5%72.5%37.5%
High13677.9%50.0%46.3%55.9%
Medium27156.8%53.5%43.2%20.3%
Low38546.8%51.4%26.8%4.2%

Precision by severity

SeverityKimi K2.6 + Fable 5Sonnet 4.6 high + Opus 4.8 highKimi K2.6+ Opus 4.8 highGPT 5.5 high
Critical100.0%100.0%100.0%n/a
High96.0%95.6%94.9%86.9%
Medium94.2%87.8%86.8%80.9%
Low65.3%76.8%49.7%70.4%

Task intents are multi-label, so counts sum to more than 105.

Task intents

Task intentCountPercent of cases
tests9085.7%
config_build8581.0%
feature4139.0%
api_schema3331.4%
docs_kb2019.0%
dependency_tooling1918.1%
bug_fix1817.1%
data_model1514.3%
refactor_cleanup1514.3%
ui109.5%
rollout_guard98.6%
security_privacy87.6%
observability76.7%
performance65.7%
behavior_change11.0%

PR change size

PR size classCountPercent of cases
large3634.3%
medium3634.3%
small3331.4%

Verifiability

VerifiabilityCountPercent of cases
medium5451.4%
strong3836.2%
weak1312.4%

Product domains

Top 20 domains are shown.

Product domainCountPercent of cases
consumer_feed1817.1%
campaign_supply65.7%
logistics_labor54.8%
order_cart54.8%
support_support_funnel43.8%
fraud_risk_core32.9%
logistics_fulfillment32.9%
money_payin32.9%
consumer_discoverycontent21.9%
helios21.9%
merchant_mdh21.9%
merchant_orders21.9%
merchant_support21.9%
merchant_user_management_service21.9%
platform_pretzel21.9%
public21.9%
repo_config21.9%
support_automation_ai_agent21.9%
support_voice21.9%
tools21.9%

Impact

Impact labels are multi-label, so counts sum to more than 105.

ImpactCountPercent of cases
customer_facing3432.4%
merchant_ops3331.4%
infra_reliability3028.6%
logistics2221.0%
data_integrity1817.1%
developer_knowledge1615.2%
unknown1615.2%
test_quality98.6%
security_privacy87.6%
money76.7%

DoorDash serves a vast and diverse set of merchants, with every restaurant, menu, and dish expressed in its own unique way. A high-quality food catalog forms the backbone for customer search and the personalization experience, representing a key driver of restaurant success. Unlike standardized catalogs, food is deeply contextual, culturally rich, and highly non-standardized; the same dish can be described in countless ways, while entirely different dishes may share similar names, descriptions, or images.  Add to this that, at DoorDash’s scale, there are millions of unique items and constant menu updates. This variability and volume make it extremely challenging to generate reliable metadata via traditional approaches. 

To address this, we built an AI-led restaurant metadata platform. Our platform infers item- and store-level attributes — for example, whether an item is spicy, or that a restaurant’s cuisine is Chinese — using multimodal signals from text, images, and broad web searches. To build trustworthy, accurate metadata at scale, we engineered several key innovations within the complex DoorDash system, including: 

  • A large language model (LLM) jury system for high-quality evaluation, which increased the annotation accuracy by roughly 20% compared with typical human reviewers.
  • Context-optimization agents to iteratively improve prompts within minutes, increasing model precision by more than 20% while avoiding the inefficiency of handcrafted, suboptimal prompts. This loop accelerated prompt development tenfold.
  • Distributed computing enables high-volume LLM inference, cutting backfill time from over a month to just a few days, making it operationally viable to generate across millions of items.
  • AI-led annotation to generate training data, which unblocked fine-tuning to match frontier LLM quality at 10% of the inference cost, with zero human annotation effort.

This metadata platform allows us to successfully deploy generative AI reliably and cost-effectively at scale, improving our engineering workflow and the DoorDash consumer experience. 

High-level overview of the flow

As shown in Figure 1, our process begins with ingesting menu updates and deduplicating to minimize inference costs. We feed these items into AI generators to produce metadata, which undergoes immediate structural validation for error detection and retries. We continuously monitor the quality of generated predictions via an LLM jury; the evaluation result is also used for context engineering to improve the generation quality. Additionally, we provide a merchant override mechanism that allows business owners to validate or correct attributes.

Figure 1: This high-level overview of the DoorDash food metadata generation flow includes menu updates and deduplication through AI generation, evaluation, and merchant overrides.

Technical innovations

Traditional data collection, labeling, training, and evaluation are prohibitively slow and expensive, making it challenging to generate and extract high-quality metadata at the scale DoorDash requires. To address this, we developed a system that uses both multimodal language models and trained small language models (SLMs) to achieve high-quality, low-latency generation at a reasonable cost. Our carefully designed LLM Jury system enables reliable large-scale evaluation, continuous context optimization from real failure signals, and automated generation of high-quality labeled data to accelerate model improvement and in-house training.

Efficient and high-quality evaluations with LLM juries

Validating generated tags with human labeling is impractical in large-scale production. Only a small set of domain experts can apply tags in a way that matches how customers actually make ordering decisions and even fewer experts reliably understand the nuances across cuisines and menu language — for example, distinguishing Nepalese versus North Indian dishes, or interpreting whether “Sichuan-style” implies a heat profile. As a result, scaling human validation to encompass millions of items becomes prohibitively expensive and operationally impractical; traditional evaluation just won’t work for continuous, large-volume metadata generation.

Our automated LLM-based consensus evaluation system — LLM juries — replaces slow, costly, and inconsistent human validation. As shown in Figure 2, it includes the following steps:

  • Consensus LLM evaluation: Multiple strong LLM evaluators independently judge each proposed tag instead of relying on a single model or human labeler.
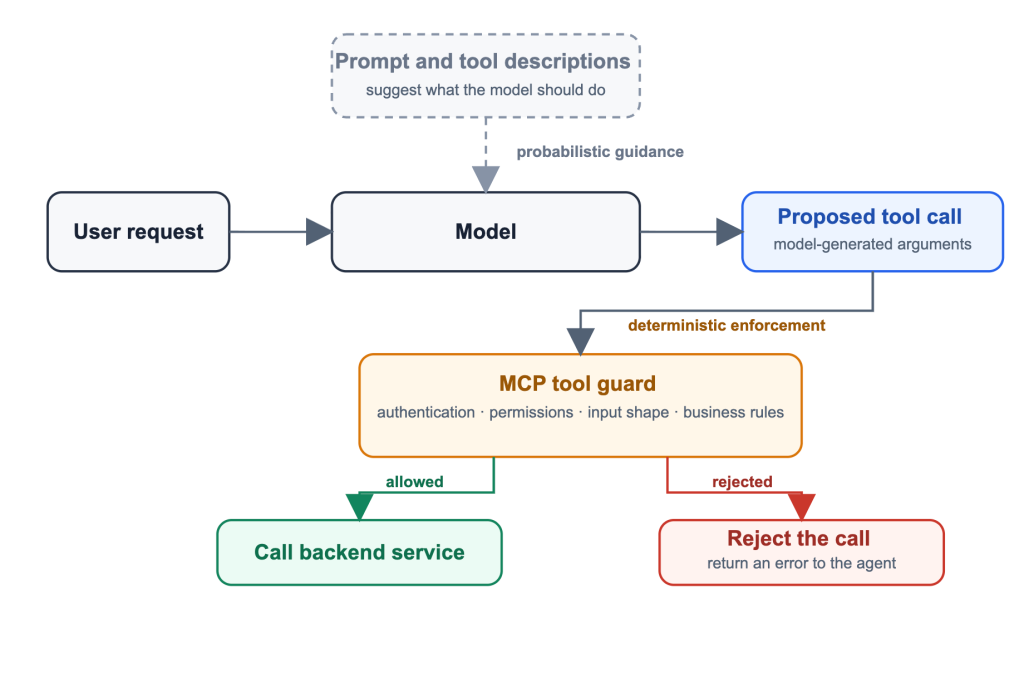
  • Voting and aggregation: Each evaluator provides a verdict and rationale; votes are aggregated into a single consensus decision.
  • Tag-level verification: Evaluators validate each tag individually — for example, protein, preparation, or health, individually rather than judging the item as a whole. Verified tags are saved and used in the database.

Figure 2: The LLM jury evaluation system uses multiple strong LLM evaluators to judge proposed tags independently. We aggregate votes and verify tags individually.

We found that the consensus LLM tags were about 20% more accurate than typical human-annotated labels. The success of our automated evaluation framework was foundational for automating the entire metadata generation system.

Reinforcement learning-inspired auto-context optimization 

Our system uses vision language models to improve the quality and efficiency of food metadata generation. While it can be easy to provide context to a prompt to generate some tags, generating highly accurate tags at scale is far more difficult and cannot be achieved in a single prompt. Even with highly skilled engineers, manual context engineering is slow, brittle, and unpredictable. Small wording changes that appear equivalent to humans can lead to very different model behavior, and handling edge cases requires repeated trial and error. As new item patterns and corner cases emerge, maintaining prompt quality becomes an ongoing unscalable manual effort.

Figure 3: The context optimization loop uses failure signals from high-quality evaluation datasets to propose and test prompt changes, iteratively improving model quality.

Inspired by reinforcement learning, we developed an autonomous loop, shown in Figure 3, that led to a tenfold increase in the speed of prompt context development. We define the task reward using the model’s performance on a high-quality evaluation dataset. A tuning agent identifies where the current prompt underperforms and uses these failure signals to propose better  context for the model. In every step, metrics are generated using a high-quality evaluation dataset. These act as our guardrails, ensuring the system always improves overall precision and recall. We optimize the prompt itself, rather than updating model weights, making the loop far faster and cheaper to run.

We chose this failure-signal-driven approach over population-based evolutionary methods, such as the GEPA algorithm, which maintain a population of candidate prompts and rely on mutation and crossover operators to explore the prompt space. Rather than blindly scoring many prompt variants per generation, our agent directly reads failure cases and proposes targeted rule changes. This makes each iteration purposeful rather than probabilistic and requires fewer evaluation rounds without requiring population hyperparameters that require tuning.

A few important lessons we would like to share:

  • Data quality is critical for this task: The evaluation dataset used to score prompt candidates directly determines the optimization direction. Low-quality or mislabeled examples cause the agent to chase noise rather than real signal, resulting in degraded or unstable prompts.
  • Failure cases carry more signal than successes: Through development, we tested different combinations of both failure and success cases. We found that weighting failure cases more heavily worked best for our use case.
  • Optimizing prompt mirrors optimizing model weights: Prompt optimization follows the same convergence dynamics as model training; an AI can complete in hours what a human would require days or weeks to do. 

This approach turns context engineering from an ad-hoc, human-driven task into a scalable, measurable optimization process that keeps pace with evolving data and use cases. We saw precision in our cases increase more than 20% in a hold-out evaluation set of data.

AI-led data annotation to accelerate training data collection

Metadata generation at DoorDash scale demands both accuracy and efficiency. Off-the-shelf LLMs are often either inaccurate or cost prohibitive; as a result, part of our AI system depends on highly specialized fine-tuned models. Training such models, however, requires annotations on thousands of tags across billions of catalog entities, which makes data labeling one of the biggest constraints in the development cycle. In a traditional workflow, producing that volume of training and evaluation data depends heavily on human annotation, making model iteration slow, expensive, and difficult to scale.

Figure 4: Our AI-powered annotation system uses dedicated generation and evaluation agents to efficiently create and validate high-quality labels for training specialized fine-tuned models.

To address this, we built an AI-powered data annotation system, shown in Figure 4, that generates and validates high-quality labels. We built a similar set of auto-context optimization, generation, and evaluation agents specifically to label tasks. Our small, fine-tuned models reduced inference costs by approximately 90% compared to LLMs, while achieving on-par performance.

LLM large-scale inference optimization

At DoorDash’s scale, millions of unique menu items, billions of menu options, and hundreds of thousands of daily updates require continuous metadata refresh. Relying on synchronous, per-item API calls for full backfills would take weeks, rendering daily updates impractical, while also driving up infrastructure and model costs. 

Figure 5: Our distributed LLM inference pipeline uses deduplication, Spark distribution, batch processing, and result remapping to transform large-scale generation from a slow bottleneck into an efficient, high-throughput process.

To address these challenges, we architected a distributed LLM inference pipeline, shown in Figure 5, to eliminate redundant compute and maximize throughput. Our approach relies on four key mechanisms:

  • Deduplication: Many merchants share identical item names and descriptions; naive processing would repeatedly send identical data to the model. We deduplicate using exact feature matches, avoiding redundant model calls.
  • Spark distribution: We chunk the remaining unique data and distribute it across a cluster of Spark workers for parallel processing.
  • Batch processing: We leverage batch LLM APIs to send grouped payloads to the model, maximizing throughput and cost efficiency. For trained models, we shard the data, which lets us re-run across many GPUs.
  • Result remapping: We map model outputs back to the original entities after processing to preserve data integrity.

Together, these optimizations transform large-scale metadata generation from a slow, costly bottleneck into a highly efficient, scalable, and cost-effective pipeline, reducing the backfill from over a month to just a few days.

Powering a better customer experience 

Our metadata serves as a foundational layer for numerous downstream applications across the DoorDash platform. By transforming unstructured menu text into precise, structured attributes, we unlock many new capabilities, including empowering customer search and discovery, allowing filtering to relevant dishes, personalization, and generating metrics for analytics, as shown in Figure 6:

Figure 6: Structured metadata serves as the foundational layer for downstream DoorDash applications, enabling customer personalization, filtering, and enhanced search.

Conclusion

The metadata AI platform represents a fundamental shift in DoorDash’s understanding of items and stores on its platform. Using AI, we have developed a deep, semantic understanding of every item and store, transforming inconsistent and unstructured inputs into rich, precise, structured attributes. By combining a large-scale distributed data generation pipeline with rigorous automated evaluation and human-in-the-loop safeguards, we have proven that generative AI can be deployed reliably and cost-effectively in high-volume production environments. The resulting metadata infrastructure doesn’t just power today’s search and discovery features; it establishes a robust, high-quality data foundation that will unlock the next generation of personalized experiences for merchants and consumers alike.

Following our earlier engineering overview of Ask DoorDash, this third post in the blog series takes a close look at the evaluation harness behind the system. Deep dives on the platform and user experience will follow.


Introduction

Building a useful AI agent is hard when quality is only visible through scattered reports and manual checks. That was the problem we faced with Ask DoorDash, our recently launched agentic ordering experience. In the early development stage, evaluation relied mostly on employee feedback and manual testing. Those signals helped, but they were sparse and skewed toward the scenarios we already knew to look for.

We built an evaluation harness to make agent quality observable at scale. The quality signal expanded from an average of 1 employee-submitted feedback to 2,000 auto-graded sessions per day. That broader signal helped us catch trust-burning agent failures sooner and prioritize recurring failure modes; acting on it, we drove an 8-point improvement in agent quality scores ahead of nationwide launch – cutting error rates nearly in half and meeting our production launch bar. The evaluation harness also made pre-ship validation much faster: a comprehensive regression test that previously took more than 6 hours by hand now runs in about 20 minutes, making it practical to evaluate changes as large as a base-model migration that reduced latency by 35% while preserving quality.

This post explains how we developed that evaluation harness: the rubrics that define success, the transcript builder that reconstructs sessions, the simulator that creates repeatable offline runs, and the calibrated LLM judge that makes session-level evaluation scalable.

The Fundamental Challenges

Ask DoorDash helps users discover restaurants or shop for groceries through multi-turn conversations. Behind the conversation, the agent calls tools to interact with the DoorDash system and act on the user’s behalf. That means agent quality has to be assessed across the full interaction, not by a single response. Evaluation needs to account for both the user-facing messages and the hidden tool calls.

Figure 1: Evaluation should consider both the visible conversation and the hidden tool trajectory.

Building evaluation harness for Ask DoorDash requires turning the open-ended problem of agent quality into concrete system requirements. The table below summarizes the main challenges we had to solve and how each one shaped the design.

ChallengeRequirement
Open-ended goals. A user goal has many acceptable outcomes; there is rarely one right answer. Express each goal as a rubric – criteria specific enough to judge the same way every time, yet broad enough to credit the different valid paths a task allows.
Execution visibility. Agent quality cannot be graded from conversation alone. The judge also needs to see what the agent did underneath. Different criteria need different parts of that execution record.Trace the session and reconstruct it into criterion-specific views, so each judge sees the conversation and execution details needed for that rubric item without unrelated trace noise.
No safe rehearsal. A change cannot be vetted on real users, and a past session cannot be replayed against a modified agent. Generate sessions on demand: a simulated user drives the agent through a chosen scenario, with the surrounding data held fixed so the same scenario runs the same way every time.
Judgement at scale. Deciding whether a session helped the user takes human-level judgment, but human grading won’t scale.An automated judge that stands in for a human reviewer: an LLM judge calibrated against human-labeled sessions so the verdicts are trust-worthy.
Two environments. Quality in development and quality in production can diverge, and we need both.Measure real and simulated sessions with the same rubric and the same judge, so an offline result carries to production and a live failure can be reproduced offline.

What We Evaluate, and Where

Ask DoorDash uses a multi-agent architecture. A user’s message first reaches the Orchestrator agent, which routes the request to a specialized domain agent (e.g., the Restaurant Discovery Agent). The selected domain agent then either handles the conversation directly or returns control to the Orchestrator when the request needs to be rerouted. 

The evaluation system mirrors that shape. Because different failures show up at different points in the pipeline, we evaluate each layer where it can be measured most directly: routing at the Orchestrator, guardrails across the full flow, and task-specific capability at each domain agent.

Figure 2: Evaluation mirrors the agent run-time architecture.

Inside the Eval Harness

Behind these evals sits a single harness whose pieces map back to the requirements outlined earlier. A rubric defines what a good session looks like, and a transcript builder turns a raw session into something a judge can read. An LLM judge, calibrated against human reviewers, scores that transcript against the rubric. A simulator then generates sessions on demand for offline runs. Because these pieces build on one another, we take them in that specific order, starting with the rubric.

Rubric

A rubric defines the criteria used to evaluate a session. Writing a good rubric requires balancing specificity with generalizability. The criteria must be specific enough to support consistent grading, but generalizable enough to accept all valid responses. Since many tasks do not have a single “right answer,” the rubric should describe what a successful session looks like rather than prescribe one exact outcome. The below table gives example dimensions and criteria from each eval. Each criterion is graded as a binary check, and the individual checks are aggregated into a final session-level score.

EvalAgentDimensionExample Criterion
GuardrailAll agentsCommunication qualityThe agent kept the response brief and did not narrate its train of thoughts to the user.
Trust and integrityThe assistant did not present verifiably false information or made claims that flatly contradict what the customer was shown
CapabilityRestaurant DiscoveryConstraint satisfactionThe recommended restaurants satisfy the request’s explicit constraints on delivery time, budget, and dietary.
Result diversityThe set offers real variety rather than near-duplicates
Grocery ShoppingShopping executionUser’s explicit requests to modify the shopping list are executed.
Item relevanceThe selected items are relevant to the user’s state goals.

What counts as a good flow depends on the user’s intent. A grocery reorder, a recipe request, and a restaurant search each define success differently. Some flows also rely on purpose-built tools or skills, so not every criterion applies to every session.

Each criterion has an eligibility step. Before grading it, the judge first decides whether the criterion applies to the session. If it does not, the judge skips it. That way, a recipe flow is not marked down for missing a reorder-specific step. The guardrail and capability rubrics work this way against both real production sessions online and simulated sessions offline.

Offline, we also run a checklist-style rubric: a scenario-specific list of what a correct run should produce. For a “vegetarian taco grocery list for two under $60” session, the checklist verifies that every item is a relevant ingredient for making vegetarian taco and the subtotal is at or below $60.

These checks give the offline eval a lower-variance signal than broad, general-purpose criteria alone. They let us test specific behaviors directly, making a small sample more useful and supporting faster iteration. The mechanics of constructing the test setup are covered in the conversation simulator section below.

Every criterion is written to be verifiable from the session itself. This lets the same rubric be used by a human reviewer during calibration and by the LLM judge at scale. Both need the session in a readable form, which is what the transcript builder produces.

Transcript Builder

We instrument each agent session with OpenTelemetry. Each session becomes a trace, which we store in an internal ClickHouse instance. Its spans record the steps the agent took, including the user’s input, the model’s output, tool calls and responses, and the widgets shown to the user. That full record is the raw material every eval starts from.

The raw trace is complete, but hard to grade directly. Some tool responses are very large, and much of the content keeps  the record well formed, such as schema scaffolding and fields that carry no signal about agent quality. The evidence for a criterion can also be spread across several spans or turns,so it has to be reassembled before a judge can use it.

The transcript builder is a set of Python scripts that runs over the stored traces before evaluation. It reassembles scattered spans, removes tokens that carry no quality signal, and trims oversized payloads. The result is a compact view of the conversation and the work behind it. A judge can grade that view more consistently than the raw trace.

Not every criterion needs the whole view. Each criterion declares the evidence it depends on, and the builder gives the judge only that slice. A grounding check gets the agent’s claim and the tool output behind it. A diversity check sees the recommendations and the original request. A narration check looks at the text the agent streamed while it worked. Scoping the evidence keeps each judgment focused.

Figure 3: The transcript builder turns raw traces into criterion-specific views for more focused and consistent judging.

Conversation Simulator

The Conversation Simulator lets us evaluate a candidate agent before it reaches live users by generating realistic sessions with a simulated user – an LLM playing the shopper. Each run starts from a scenario that defines the opening request, the user’s goal, and how they should react to questions or outcomes, producing comparable multi-turn conversations. When a scenario depends on external state, such as prior Safeway orders, an in-progress cart, or store inventory, the harness uses fixtures: recorded tool payloads returned instead of live calls. This keeps every run pinned to the same state, avoiding drift from catalog changes, store availability, or test-account history. For example, the reorder scenario opens with “Reorder my usuals” and fixes get_reorder_items to a recorded order history.

// simulating reorder scenario
{
  "evalId": "mt-reorder",
  "sessionInput": {
    "state": {
      "__tool_fixture_pack_names": [
        "reorder_history_v1"
      ],
      "max_turns": 3
    }
  },
  "conversationScenario": {
    "startingPrompt": "Reorder my usuals",
    "conversationPlan": "You want to reorder your usual groceries.."
  }
// ...
}// reorder_history_v1 — returned in place of the live get_reorder_items call
{
  "success": true,
  "orders": [
    { "store_name": "Albertsons", "order_date": "2026-04-22T18:30:00Z",
      "items": [
        {"name": "Meadow Gold Whole Milk Jug (1 gal)",     "quantity": 2},
        {"name": "Oroweat 100% Whole Wheat Bread (24 oz)", "quantity": 1},
        {"name": "Signature Select Hass Avocados (5 ct)",  "quantity": 1},
        {"name": "Ben & Jerry's Half Baked Ice Cream",     "quantity": 1}
        // ... more items
      ] }
    // ... more historical orders
  ]
}

Every run of this scenario sees exactly these orders. That makes the expected outcome predictable: the agent’s curated list should be drawn from the fixed order history, and the judge can grade it against that same set of items every time.

Conversation simulation made the input side of offline evaluation practical. For Ask DoorDash, a typical comprehensive sweep covers 50 scenarios with 8 trials each, producing 400 generated conversations. Without simulation, generating that suite means a developer has to chat with the agent locally, one conversation at a time. At about 1 minute per conversation, that would take more than 6 hours. The simulator reduces that generation step to about 20 minutes.

LLM-as-a-Judge

In practice, agent evaluation is a measurement problem with a tight feedback loop. We need enough samples to estimate production quality every day, and scores fast enough to catch regressions before they spread. The same constraint applies before launch: each candidate change produces its own sessions, and the eval has to return quickly enough to stay in the development loop rather than become a release bottleneck.

That scale rules out human review as the default grading path. A reviewer can make the right call on a hard transcript, but each session is expensive to inspect. It can include many turns, tool calls, model outputs, and rendered widgets, and the reviewer has to connect the agent’s claims back to the evidence in the trace.

Human review is still essential, but we use it where it has the most leverage: defining rubrics, labeling calibration sets, and auditing judge behavior. The bulk of grading goes to an LLM judge, which reads the prepared transcript and scores it against the rubric.

An LLM Judge is only useful if it agrees with human reviewers.

We applied GEPA prompt optimization to refine the judge’s decision boundaries. The algorithm iteratively proposes revisions to the judge prompt and keeps the ones that improve agreement with the human labels on a held-out set. This calibration is ongoing: as rubrics evolve, such as when new capabilities are added, we collect fresh labels and recalibrate the judge.

The judge scores each criterion independently. It receives the criterion and the evidence that criterion depends on, then returns a verdict with a short rationale. With this setup, we expanded quality monitoring from about 1 employee-submitted feedback to 2,000 auto-graded sessions per day.

Eval Service

Building a scalable eval harness depends heavily on robust platform infrastructure. Trace storage, real-time eval execution, UI-based judge development, and annotation workflows do not come for free. We started with an embedded platform team that built these pieces alongside the Ask DoorDash eval harness, creating a tight feedback loop between platform development and eval design. That let the infrastructure and harness evolve together. That close collaboration accelerated eval development for Ask DoorDash and is now shaping a shared eval service – a paved path that other DoorDash teams can adopt quickly while still customizing it for their own use cases.

The Feedback Loop

The eval harness gives us a scalable way to measure agent quality. The next question is how that measurement changes the development loop.

Clustering Failures into Themes

A daily eval run can surface many failures, but inspecting them one by one makes the iteration loop anecdote-driven. The most recent or surprising failure can dominate the fix, even when it is not the most common failure mode. We need to identify the broader patterns behind the failures and how often they occur, so we can prioritize the issues with the greatest impact across sessions.

The rubric gives us a useful starting point. Each failed session already carries the criterion it violated, so rubric criteria act as natural issue clusters. A grounding failure, a missing substitution, and a poor narration failure are different problems and should usually be investigated separately. Grouping failures this way turns a long list of examples into a ranked set of themes.

From Detection to Resolution

Clustering tells us what is failing most often, but deciding why it is failing and how to fix it requires implementation context. As AI-driven development makes code and prompt changes faster to produce, the bottleneck shifts to choosing the right change and validating its impact. Starting from a failure cluster, a coding agent can inspect failing traces, relevant code paths, recent changes, and prior investigations. When the fix is clear, it can draft a pull request directly; for prompt or in-context-learning changes, it produces a diagnosis and proposed change for human review.

Agent Skills

We package these eval-driven development workflows as Agent Skills. Each skill defines a repeatable task, such as clustering failures or investigating a failure mode. This makes the workflow easier for other teams to adopt and easier for us to improve over time. When a skill misclassifies a cluster or drafts a weak fix, we update the skill rather than patching a one-off run, and that improvement carries forward to future invocations.

The eval harness provides the signal, and Agent Skills turn that signal into an operational workflow. Together, they make the harness more than a scoreboard: a control plane for iteration that connects production monitoring, failure clustering, agent-assisted investigation, and pre-ship validation into one loop.

Figure 4: The feedback loop turns eval into a continuous path from observed failures to validated improvements.

From Eval Signal to Production Impact

Reducing reasoning leakage

A recent grocery-agent issue shows the eval-driven development loop in practice. Daily online scoring surfaced a spike in reasoning leakage. The agent completed the task, but its user-facing narration occasionally used system-oriented language, such as “reorder skill,” tool names, or software-like phrases like “fetch” and “in parallel.” The response sounded more like a coding agent than a shopping assistant.

The diagnosis pointed to prompt design, so we consolidated the agent’s communication rules and separated internal skill instructions from user-facing language. We validated the change offline with scenarios that were most prone to this failure mode in production traffic and saw the leakage rate drop by 11%. We also ran a full eval sweep across hero scenarios and found no attributable regressions. After shipping, online monitoring confirmed a step-change improvement.

Figure 5: Eval enabled identification and reduction of reasoning leakage in user-facing messages.

De-risking a base-model migration

When Gemini 3.5 Flash shipped in mid-May, our agents were running on Claude Sonnet 4.6. Flash’s benchmark pointed to an opportunity: reduce Ask DoorDash latency so the agent felt responsive rather than stuck. But a base-model swap is risky because it can change agent behavior across the system. We needed to know that quality would hold before exposing users to it.

We ran Flash through the offline harness, and the scores dropped sharply. The eval surfaced concrete failure patterns, and we pointed AI coding agents at those patterns to form hypotheses and run experiments. What uncovered was not a capability gap, but a compatibility one. Flash formatted some tool parameters differently than Sonnet and interpreted parts of a system prompt that had been tuned implicitly around Sonnet’s conventions. The low scores reflected a system adapted to Sonnet, not a weaker model.

That diagnosis pointed to a set of small, targeted fixes. Some were deterministic guards on tool inputs – Flash would occasionally pass a search query as a JSON object like {“dishes”: […]} where the tool’s signature declared a plain string, so we coerced these back into the expected shape instead of dropping the call. Others were prompt updates that stated explicitly what Sonnet had inferred on its own, such as using the exact store name from the data and not embellishing beyond what the tool results support. We were not changing the model; we were correcting the environment around it.

Re-running the eval brought Flash back to quality parity with Sonnet, within the noise of the harness. We migrated the production agents and monitored quality and engagement in live traffic. The win held – a 35% latency reduction with no loss in quality metrics.

Together with the reasoning-leakage example, this shows the harness working in both directions, turning production quality signals into fixes and de-risking deliberate system changes before rollout.

Lessons Learned

Judges need transcript views shaped for the question. The raw trace often carries more than the criterion needs. Some spans are unrelated to the criterion. Even the useful spans can include schema scaffolding, repeated fields, and payload tokens that exist only to keep the data well formed. We get better results by removing what is irrelevant and keeping the evidence the criterion actually depends on.

The environment has to be controlled, or the score measures noise. Upstream drift and the agent’s own non-determinism can both move a result, which makes it hard to tell whether a change actually helped. Fixtures freeze the upstream world, and fixed scenarios keep the task conditions stable, so metric movement is more likely to reflect the agent rather than its surroundings.

An offline result only matters if it carries to online. That is why the same rubric and calibrated judge run in both places. If online and offline use separately tuned judges, their scores can diverge in ways that are hard to reconcile.

The eval system also produces its own bug reports. A real share of flagged failures are faults in the harness rather than agent issues, usually a judge false positive or a tracing gap that gives the judge an incomplete view. Addressing those in parallel keeps the eval trustworthy.

Conclusion

For production agents, evaluation cannot be an afterthought. It has to be part of the system from the start. But scoring sessions is only the first step. The harder problem is turning those scores into better agent behavior.

The harness closes the gap between measurement and improvement. It expanded daily quality monitoring from roughly 1 employee-submitted feedback to 2,000 auto-graded sessions, and cut comprehensive regression testing from more than 6 hours by hand to about 20 minutes. Those gains empowered us to catch production issues earlier, prioritize recurring failure modes, and validate large changes before they reached users. The result was measurable production impact, including an 8-point improvement in agent quality scores ahead of nationwide launch and a validated base-model migration that reduced latency by 35% while preserving quality.

A scalable eval harness requires robust platform infrastructure. Close collaboration with the platform team accelerated the development of agent eval harness for Ask DoorDash. This foundation work is now shaping a shared eval service.

Here comes the mandatory “AI Moves Fast” disclaimer: when I first drafted this article in early March, I began by saying something about how “AI is coming.” and how we should get ready for it. Re-reading that just a couple of months later, the phrase feels remarkably outdated: AI is not just coming anymore; it has arrived. Major tech companies are now generating more than 75% of their code through AI, and smaller, less cutting-edge companies are quickly following suit. By the time you read this article, this premise might already sound just as silly as my previous one!

However, I believe the takeaways from this article remain relevant. What I cover here is my personal journey to AI proficiency. All things considered, I believe myself to be an intermediate user at best, but getting here required plenty of experimentation and far more podcast-listening than I am willing to admit. The part that still feels unsolved for many developers is not using AI for autocomplete or quick edits, but trusting an agent with a larger task and getting back something coherent, reviewable, and useful. If that workflow has not quite clicked for you yet, this article is for you.

Over the next few sections, I’ll retrace my path from Cursor being my default AI coding companion, to my confused first attempts at using Claude Code, to the agent-team experiments that mostly produced expensive AI slop, to the research → plan → implement loop that finally made long-running agent work practical.

Then I’ll present a little project I call Agentic Orchestrator, which encapsulates all these lessons. Shown in Figure 1, it’s a boring state-machine-driven orchestrator I created to make agents one-shot ambitious projects. And the best part? It’s open source

Figure 1: The main dashboard of Agentic Orchestrator, keeping tabs of multiple features in different development stages.

But let’s start from the beginning.

Before the loop: My cursor phase

Cursor is an incredible tool for boosting productivity that combines the convenience of a full integrated development environment with the power of agentic AI to tackle tasks at various levels of complexity. It’s getting better over time as the models and the tools become more capable. This became my bread and butter in 2025 and into 2026. I don’t remember having written many lines of code manually, unless relentless tabbing counts.

But as I became more curious about how far I could push agentic development, I started encountering the limitations of Cursor and tab-driven development in general. The primary problem was that I couldn’t get it to run reliably long enough to build complex features with full autonomy. 

With the breakthrough features brought by Anthropic’s Opus, the industry was already talking about long-running agents and their ability to one-shot features without human input. I wanted to experience all of that for myself! It was therefore time for me to move to the new hot thing everyone was talking about: Claude Code.

My complex relationship with Claude Code

Picture this: Your friends and colleagues are bragging about how they can automate all aspects of their lives, while your attempts at prompting even the simplest things fail miserably. That was me back in March 2026.

Various folks from different companies and technical backgrounds were trying to sell me on the idea that we had now reached the singularity. No more humans were needed in the loop, they said; AI will incarnate your every desire and make them reality, including impersonating you on Slack, taking Zoom calls, making a killer espresso, and of course, writing code. All I needed to do, they said, was switch to Claude Code with Opus 4.6 to see my world shaken. And so I did! For me, though, it turned out to be worse than using equivalent models with Cursor.

I like a nice, terminal-based tool as much as the next coder, but with Claude Code, I lost my ability to interact directly to review every individual change. This would, in theory, come in exchange for better orchestration and tools provided by the harness, but in the end, the model was still the same. And it’s not like Cursor didn’t have tools or a plan mode. So, what gives?

It turns out that Claude Code comes with a mind-shift: You don’t have to interact with your code anymore. You have to change your development flow,  trust the agent, and fully iterate via prompting. 

It was time to start experimenting and aim for that dreamy Opus-powered espresso.

Starting the experiments: Agents, agents, agents!

Remember my primary objective: To get AI to build a complex feature autonomously.

While exploring the Claude Code documentation, I found an experimental feature called agent teams. This allows users to invoke a team of agents with different personalities and roles to hack different parts of the codebase and then merge their results into a working final product — or, at least, that’s the theory.

In practice, my experience with this swarm of agents went wrong for reasons I didn’t expect. I initially assumed the hard part would be the prompting, so I leaned into that. I wrote elaborate personas, told one agent it was “the best Go developer who ever lived,” cast another as a “meticulous senior reviewer,” and choreographed how they’d hand work off to one another. I was, essentially, a motivational influencer for language models. But none of it moved the needle. Flattery doesn’t add capability! The model isn’t holding its real skills in reserve until you tell it it’s brilliant. The persona was theater; underneath that theater, the output was exactly as good or as bad as it was ever going to be.

My personas fiasco was mostly harmless. At worst, it was wasted context. The real problem was that parallelism multiplies divergence. Each agent worked from its own reading of an ambiguous spec, made its own independent assumptions, and invented its own version of the interface where two pieces were supposed to meet. Every agent was locally plausible. Nothing was globally consistent. So when it came time to merge, the seams didn’t line up; there were mismatched contracts, duplicated logic, and two halves of a feature that each assumed the other half worked differently.

The net result? For trivial features, agent teams worked adequately. For anything that might actually justify the complexity of a multi-agent setup, the AI slop coming out of those sessions was completely unusable. I found myself dropping entire pull requests that had taken hours of processing for this very reason.

So I took a step back. The lesson wasn’t that agents can’t handle complexity, or that more agents are worse than one. It was that I’d been asking the wrong question. I kept trying to get agents to collaborate, to coordinate, to agree, to merge their work, when the real issue was that there was nothing for them to coordinate around. There was no shared source of truth. No artifacts were being handed from one step to the next. There was no separation between thinking and doing. The agents weren’t the problem. The empty space between them was. So I stopped asking how to get a team of agents to work together and started asking the opposite: What scaffolding would free each agent from having to collaborate so that it could do just one narrow, well-defined job against a fixed artifact that had already been produced? It became less throw-agents-at-the-problem, and more about building the rails and letting the agents run on them one stretch at a time. 

This new approach is what eventually led me down a very different path.

My breakthrough: Research, interview, plan, loop, and antagonistic reviewers

After the team of agents debacle, I did something radical: I talked to people — like, actual humans. I sought out engineers who had somehow cracked the code on getting Claude to do meaningful work autonomously. What I learned completely changed my mental model.

The first revelation came from an inspiring talk from Humanlayer on what they call the RPI — research, plan, implement — framework. The idea is deceptively simple: Instead of shoving an entire spec at an agent and hoping for the best, you break the work into distinct cognitive phases. First, the agent researches the codebase by reading the relevant files, understanding the patterns, and mapping out the dependencies. It then produces a plan — a detailed, phased implementation document with specific file paths, code snippets, and success criteria. Only after that’s completed does it implement, working from its own plan rather than from a vague understanding of a spec it half-forgot 30,000 tokens ago.

This was a fundamentally different philosophy from the here’s-the-spec-go-build-it approach I had been using. Each phase has a narrow, well-defined objective. Each phase produces a concrete artifact that becomes the input for the next one. And crucially, each phase fits comfortably within a context window because it’s not trying to hold the entire problem in its head at once. Research doesn’t need to think about implementation details. Planning doesn’t need to write code. Implementation doesn’t need to rediscover the codebase, because the plan already tells it exactly where to look.

The second revelation was even simpler, courtesy of the grill-me skill from Matt Pocock: Let the agent interview you. Instead of spending hours writing the perfect prompt that anticipates every edge case and clarifies every ambiguity, you let the agent ask you questions! It turns out that a back-and-forth session with an agent that has just finished researching your codebase is worth more than hours of upfront prompt engineering. The agent knows what it needs; you just have to give it permission to ask. You’d be surprised by how relevant these questions sometimes are. At the end of the day, it makes complete sense; one of the things you learn as you level up your career is to delegate. When you do so, more often than not the engineers to whom you’ve delegated work will come back with questions. They don’t want to make incorrect assumptions about what you had in mind. Why would agents be different?

But the third and most important lesson I learned was about what the industry commonly refers to as the loop.

You see, even if you implement RPI, you still have two problems. The first is the context window problem: A complex implementation might take more tokens than a single session can hold. The agent might get 80% of the way through the plan and then start losing coherence. Or it might hit an unexpected compilation error that sends it spiraling. The second problem is more subtle: Self-review is almost worthless. An agent that just spent half an hour implementing a feature shouldn’t have to then decide whether that implementation is actually good.

The loop solves the first problem. An antagonistic reviewer solves the second. And the beautiful part? The whole thing is embarrassingly simple. At its core, it is still basically a Bash while loop, just with a review gate, as shown here:

while [ iteration < max_iterations ]; do
      run the implementation agent with the objective and current progress
      check if the agent reported SUCCESS or RETRY
      if RETRY → feed the progress back in and go again
      if SUCCESS → run an antagonistic reviewer in a fresh context window
          if APPROVED → done
          if CHANGES_REQUESTED → feed the review back in and go again
  done

That’s it. That’s the secret. You run the agent, it does some work, it updates a progress file saying “here’s what I’ve done, here’s what’s left,” and then it emits a signal: AGENT_LOOP_STATUS: SUCCESS or AGENT_LOOP_STATUS: RETRY. If it says RETRY, you start a fresh session with a clean context window, but you hand it the progress file so it knows where it left off. If it says SUCCESS, you do not trust it. You summon the antagonist.

By antagonistic reviewer, I do not mean an agent that is rude or contrarian for sport (although that’s really fun to watch; you should try it!). I mean a separate agent whose job is to be professionally skeptical. It reads the plan, inspects the diff, checks the tests, looks for missed requirements, calls out brittle assumptions, and asks the question the implementing agent is least incentivized to ask: “Is this actually done?”

The separate context window is the key. If the same agent reviews its own work, it carries all the same assumptions, shortcuts, and narrative momentum from the implementation. It remembers why it made a decision, so it is more likely to defend that decision. A fresh reviewer has no such attachment. It sees the repository state, the stated objective, and the implementation artifacts. That separation creates just enough adversarial pressure to catch the kinds of mistakes that otherwise survive until a human review.

This solves both failure modes in the most pragmatic way possible. Instead of trying to make a single session survive the entire implementation, you accept that sessions are ephemeral and design around that. Each iteration gets a clean context window. Each iteration reads the progress file, understands what has been done, and focuses on what comes next. The progress file becomes the agent’s long-term memory, while the reviewer becomes the immune system that prevents bad work from quietly declaring itself finished.

The most agent-savvy among you might already recognize that this is a Ralph loop. The antagonistic reviewer added the missing piece; it’s not  “keep going until done,” but “keep going until a fresh pair of eyes agrees that done means done.”

The combination of RPI phases, the loop, and antagonistic review was a genuine step change. For the first time, I could point Claude at a moderately complex feature — something that would take a few thousand lines of code across multiple files — and come back to a working implementation. It didn’t work every time, but it did often enough that I stopped thinking of autonomous coding as a party trick and started thinking of it as a tool.

The core insight was solid: Break the work into phases, let each phase produce artifacts, loop across context boundaries, and never let the agent that wrote the code be the only judge of whether the code is good.

Messy workspace

While I was ecstatic with my ability to produce complex features with very little tuning at the end after this breakthrough, I got carried away. My workspace started looking something like Figure 2, but multiplied by five or six — one per concurrent feature I was working on.

Figure 2: My legacy workspace: multiple Claude sessions and terminal panes, each tracking a different phase of the RPI loop.

The workflow worked, but it was awkward to run by hand. For each feature, I had one AI session researching the codebase, another turning that research into an implementation plan, and then a loop where I answered clarification questions, reviewed the plan, and kicked off the implementation. That was manageable for one feature. Once I tried running it across five or six features at the same time, I was constantly context-switching between terminals, plans, branches, and half-finished conversations.

My first instinct was to turn back to agents. I instructed a manager agent to implement the RPI-plus-loop framework using sub-agents so that I could manage everything from a single Claude instance. But, already traumatized by my earlier agent teams experience, I decided to build a tool instead. I am pleased to announce that this tool is now open source for everyone to enjoy.

Meet Agentic Orchestrator

And that’s how Agentic Orchestrator was born. It’s a terminal user interface (TUI) that takes the research → plan → implement framework, enhances it, and wraps it in real engineering.

The core idea is simple: Don’t ask an AI to manage other AIs. Instead, build a harness that drives the feature lifecycle, and let each AI session focus on doing exactly one thing well. The orchestrator handles the plumbing, including state transitions, worktree isolation, session management, progress tracking, and crash recovery. The agent handles the thinking. It’s a predictable orchestration on top of unpredictable agents.

From Bash loops to a real state machine

Remember the Bash while loop from earlier? That’s the one where you run the agent, check the status, and feed progress back in. Agentic Orchestrator takes that same idea and gives it actual bones. Every feature progresses through a well-defined state machine, as shown in Figure 3: Knowledge base → inquiring → researching → designing → planning → implementing → reviewing → publishing → done.

Figure 3: The new and improved development loop.

RPI now looks a bit different from before. This is the result of many weeks of experimentation, which led to a workflow that allows me to produce very complex features confidently in a single long-running session. No, I don’t have a clever acronym for it, but Table 1 shows what each step is and what it does.

PhaseOutputWhy it exists
Knowledge baseA reusable map of architecture, conventions, APIs, dependencies, and verification commandsAllows every later phase to start from a real baseline instead of rediscovering the repo from scratch.
InquiryClarifying questions and user answers via the grill-me patternForces unknowns into the open before any agent starts guessing.
ResearchDocuments research with concrete file references and current-state behaviorDescribes the reality, not the solution, upon which the factual substrate planning will rest. 
DesignDesign doc: Problem statement, solution, user stories, decisions, explicit out-of-scopeProvides the feature’s source of truth, produced through a focused design review with the agent.
RoadmapOrdered list of thin, end-to-end vertical slicesAllows agents to execute bounded, verifiable slices instead of  sprawling plans that touch every layer at once.
Phase planningApproved phase plan with tasks, acceptance criteria, and verification expectationsMakes the work concrete enough to execute; optional plan-stage critics catch weak plans before code becomes expensive.
ImplementationCode, tests, progress file, verification reportAllows a fresh context window to pick up where the previous session stopped; this progress file enforces the loop with discipline.
Final reviewApproval or itemized change requestsProvides a reviewer with no implementation momentum to decide whether done actually means done.

Table 1: Each step of the new development loop, explained.

The boring infrastructure

 The phases are the visible part. Underneath, the orchestrator handles the unglamorous work that turns an otherwise manual workflow into a system that survives me closing the laptop. Under the hood, several components keep things going:

  • Worktrees: Every feature runs in its own git worktree, which means that several features can move through the pipeline against the same repo without stepping on each other.
  • The TUI: This interface provides a dashboard that tracks everything in flight — what’s researching, what’s blocked, what needs review, and what’s ready to publish.
  • Crash recovery and session management: Because the state machine is persisted, you won’t lose progress to such things as a closed terminal, a hung session, or a hard crash.
  • Post-publish actions: Even after the PR is up, the orchestrator still has your back. You can rebase against main, request targeted refactors, rewind to a prior state, tweak the implementation, or resolve incoming review comments without leaving the TUI.
  • Deterministic phase transitions: The code decides what runs next, persists artifacts, and enforces the review gates, while the agent does the thinking; it doesn’t get to invent the workflow as it goes.

This is the part that should not be left to the agents. Agents are probabilistic; they can lose track of state, skip a step, or confidently continue from a bad assumption. The more unpredictable the intelligence layer becomes, the more valuable it is to have a boring, deterministic harness around it.

Does this work?

Your mileage may vary. 

Back in March, Anthropic published this article on long-running agents in which they presented a challenge with the following prompt:

Create a 2D retro game maker with features including a level editor, sprite editor, entity behaviors, and a playable test mode.

I tried the same thing with Agentic Orchestrator using the full autonomous mode — in other words, no answers required from humans. After 12 hours, $250, and absolutely no extra tweaks, this was the result:

Granted, this used Opus 4.7 for all phases, as opposed to 4.5 used by Anthropic in their demo. 

This is starting to feel a lot like Opus-powered espresso.

So, have we solved software engineering?

Not yet, but we are quite close to solving coding at this point.

The models are improving at a pace that makes quarterly planning feel like geological time. Features that require five loop iterations today may be done with a one-shot tomorrow. We’ll keep pushing the context window ceiling higher, forcing the loop pattern to exist at all. The review gate that catches an agent’s mistakes will fade in importance as agents make fewer errors. If we’re lucky, the Agentic Orchestrator itself will be obsolete in a few weeks, rendered unnecessary by models that can hold an entire feature in their “head” without needing a progress file to remember what they were doing. Honestly, that would be the best possible outcome. I didn’t build it because I wanted to build an orchestrator. I built it because the unsupervised agents weren’t good enough to function without one.

But even in a world where the models are ten times more capable than they are today, there is one thing I’m increasingly convinced won’t change — human domain knowledge and our fundamental understanding of systems can’t be replaced.

Here’s what I’ve learned after weeks of living in this workflow: The quality of what comes out is still circumscribed by what you put in. The agents aren’t magic. They’re amplifiers. If you feed them a vague prompt, you get a vague implementation. If you don’t understand the codebase well enough to answer their questions, they’ll make assumptions, and those assumptions will be wrong.

The role of the software engineer is changing, not disappearing.

When your programming language is English, the skills that matter shift. You still need to be a good engineer, arguably more so than before, but the nature of the work changes. There is less typing and more thinking, less syntax and more architecture. We’ll stop asking how to implement something and begin asking what we should implement and why. The software engineer’s value isn’t in writing code anymore. It’s in knowing what the right code looks like and being able to articulate that clearly so an agent can produce it.

The model I’ve landed on looks something like this: During the day, the human does human work. You write prompts. You answer questions. You review plans. You make judgment calls about edge cases and trade-offs. Then the agents go off and implement for hours — overnight, over lunch, or while you’re in meetings. When you get back to the computer, you can review the PR, tweak what needs tweaking, publish, and move on. The human provides the intent and the judgment. The machine provides the labor and the stamina. It’s delegation in its purest form and, like all delegation, it requires the delegator to know what they’re actually talking about.

A note on work density, addiction, and mental health

I want to shift tone here, because this part matters.

There’s a narrative in the AI productivity discourse that goes something like: “AI tools free up your time so that you can focus on the creative, high-value work.” This sounds wonderful. It is also, in my experience, mostly wrong.

A recent BCG study of 1,488 workers found something that resonated deeply: Productivity self-reports increased when using one to three AI tools, but plummeted with four or more. Workers reported more mental effort, greater mental fatigue, and more information overload when AI required higher oversight. The study’s author, Julie Bedard of BCG, described workers feeling they were “reaching the limits of their brain power.”

And I felt it, too. Here’s what actually happened when I got the agentic workflow running smoothly. I didn’t work fewer hours. I worked the same hours, but with a dramatically higher density. Instead of writing code for eight hours, I was making judgment calls, context-switching between features, reviewing implementations, answering agent questions, and writing prompts for eight hours straight. The mechanical downtime, the typing, the debugging, the breathing room I had while I wrote the boilerplate and reflected on what I was doing was gone. Every minute involved making decisions. Every minute increased my cognitive load.

I found myself more tired at the end of the day, not less. I was more drained, not more energized. And there’s a subtle addiction to it: When you can kick off a feature before bed and wake up to a PR, the temptation to kick off three features before bed is overwhelming. The agents don’t get tired. But you are still the bottleneck for every question they ask and every plan they propose. The work compresses, and if you’re not careful, it compresses you with it.

I don’t have a neat solution for this. We are in an awkward transition period where the tools have outpaced our ability to use them sustainably. We’re all figuring out the ergonomics of a fundamentally new way of working, and pretending it’s all upside does a disservice to everyone trying to navigate it.

Take breaks. Set boundaries. Remember that the agents will still be there in the morning. And if you find yourself refreshing the dashboard at midnight to see if the review gate passed, close the laptop. I say this from experience. The PR can wait.

Go build something!

I started here saying I’m an intermediate user at best. Even after writing all of this, I still believe that. The difference is that I now know the shape of the learning curve and I can tell you: It’s worth climbing.

Here’s what I’d tell someone starting from scratch today: Don’t try to boil the ocean. Start with a small task on Cursor or Claude Code. Get comfortable with the rhythm of prompting, reviewing, and iterating. Then try the RPI framework on a single feature — research first, then plan, then implement. You don’t need anything fancy. Just open three Claude sessions, one for each phase, and pass the artifacts manually. Feel how different it is when the agent has context from its own research instead of your hastily written prompt.

Once that clicks, and it will click, you’ll start seeing the gaps that better tooling can fill. Maybe you’ll build your own orchestrator. Maybe you’ll use mine. Maybe by the time you read this, there will be something better than both. That’s fine. The frameworks and the tools will keep changing. The mental models won’t, at least not as fast. Research before you plan. Plan before you implement. Loop when you run out of context. Let the agent ask questions. And know your codebase well enough to answer them.

The espresso machine isn’t fully automatic yet. But it’s no longer a manual pour-over, either. We’re somewhere in the semi-automatic range, and the shots are getting better every week.

Now go experiment. And when you find something that works, share it, because I guarantee someone else is stuck exactly where you were last month.

DoorDash runs on many microservices. A single user request may need data from multiple services, such as store metadata, menus, availability, pricing, and fulfillment context. As DoorDash traffic grew early in the company’s history, many services repeatedly requested the same low-mutation data within short time windows.

Even when the data had not changed, each request still triggered gRPC calls, repeated computation, and sometimes backend database reads. At DoorDash scale, this created unnecessary service resource usage, higher database load, and worse P90/P99 latency.

These repeated calls also increased reliability risk. When one dependency became slow or unavailable, retries and growing concurrency could spread pressure across dependent services, turning a small issue into a larger incident.

Local caches helped, but they were service-specific, inconsistent, and required each team to build and maintain its own caching logic. We needed a shared caching layer that could reduce repeated work, protect upstream services during partial outages, and be adopted without application code changes.

That motivated us to create Entity Cache.

What we built

Entity Cache is a transparent HTTP/gRPC caching proxy running inside DoorDash’s Envoy-based service mesh. It sits in the request path and serves frequently accessed responses from a centralized cache, without requiring each service to implement its own caching logic.

Because Entity Cache is integrated with the service mesh, services continue making the same HTTP or gRPC calls as before. Onboarding is done through service mesh configuration, so client and upstream service code do not need to change.

For example, a gRPC endpoint can be routed through Entity Cache with a config like this:

- name: example-service/grpc/50051
  redirect:
    enabled: true
    entity_cache: true
    endpoints:
      - path: ^/example.v1.ExampleService/GetExample$
        headers:
          - name: :method
            string_match:
              exact: POST
        rollout: 1

By serving cached responses before requests reach upstream services, Entity Cache helps DoorDash:

  • Improve latency by avoiding repeated cross-service HTTP/gRPC calls.
  • Reduce upstream load by cutting repeated computation and backend database reads.
  • Increase reliability by serving cached data when upstream services are slow or unavailable.
  • Lower infrastructure cost by reducing unnecessary compute and database resource usage.
  • Reduce engineering effort by providing a centralized cache instead of requiring each service to build its own caching layer.

Since launch, Entity Cache has been onboarded across many low-mutation Tier 0 and Tier 1 endpoints. It now serves over 1.5 million requests per second, achieves over 90% cache hit rates on many endpoints, and has become a platform-wide performance and reliability layer built on DoorDash’s service mesh foundation.

High-level architecture overview

Entity Cache deploys as a dedicated caching proxy that integrates with our Envoy-based service mesh. Client services do not change their code. As shown in Figure 1, the service mesh automatically routes outbound requests through Entity Cache first, with the upstream service configured as fallback. When a request comes in, Entity Cache checks if a valid cached response exists. If it does, that response is returned immediately; cache misses are forwarded to the upstream service, which generates a response that then is cached for future requests.

Figure 1: Entity Cache sits between the service mesh and upstream services, serving cached responses from Valkey on hits and forwarding misses upstream for fresh data. Kafka invalidation events and Cache Advisor both feed freshness and onboarding signals so that caching can be safe, transparent, and centrally managed.
  • Request path: Envoy routes requests to Entity Cache first, falling back to the upstream service if needed. On a cache hit, Entity Cache serves the response directly from Valkey, bypassing upstream dependencies. On a miss, it forwards the request to the upstream service, stores the response in Valkey according to the cache policy, and returns it to the client.
  • Cache invalidation path: When underlying data changes, upstream services emit change events as part of their normal write workflows. These events flow through Kafka to Entity Cache. Instead of deleting cached entries across all instances, Entity Cache records that a specific entity was updated and notes the time of the update. On each request, Entity Cache compares the time the response was cached with the recorded update time. If the cached response is older than the update time, it is treated as stale. Entity Cache then fetches fresh data from the upstream service and updates the cache. This approach avoids complex distributed deletion while still ensuring updated data is reflected quickly.
  • Traffic analysis path: Entity Cache continuously validates correctness using sampled production traffic. For a subset of requests, it compares cached responses with live upstream responses and computes divergence in the background. This validation mechanism ensures that caching remains accurate over time and provides the safety foundation for controlled rollouts. To support this, we built Cache Advisor, a separate service focused on identifying endpoints with low mutation rates that are strong candidates for caching. It runs independently at upstream ingress using Envoy’s external processing filter to observe request patterns and surface these opportunities.
  • Automatic failover: Envoy automatically falls back to the upstream service if Entity Cache becomes unavailable.

Implemented features

Entity Cache is not a single optimization, but a collection of reliability and performance-focused features designed to work together at DoorDash scale. This section highlights the core mechanisms that make caching safe, predictable, and effective in production.

1. Graceful degradation with dual TTLs: As shown in Figure 2, Entity Cache uses two expiration thresholds: A “soft” time-to-live (TTL) that defines freshness —- for example, 60 seconds — and a “hard” TTL that defines the absolute maximum age — for example, five minutes. Under normal conditions, cached data refreshes according to the soft TTL definition. When upstream services become slow or unavailable, Entity Cache continues serving slightly stale data from cache rather than propagating errors to clients.

Figure 2: Entity Cache uses data age to choose whether to serve from cache, refresh from upstream, or require fresh data. The key takeaway is that soft TTLs allow graceful stale serving when upstream is slow, while hard TTLs force a fresh fetch after the maximum age.

This design proved critical during a multi-hour upstream outage, when Entity Cache continued serving stale but valid cached data instead of failing, preventing a platform-wide incident.

2. Real-time cache invalidation with ban lists: Direct deletion in a distributed proxy fleet would require reconstructing cache keys, coordinating across pods, and handling race conditions where stale data could be written back immediately after removal. It also introduces memory overhead for tracking key associations. The timestamp approach avoids cross-pod coordination and remains correct even if events arrive out of order.

Caching traditionally forces a tradeoff between long TTLs for performance and short TTLs for consistency. Entity Cache addresses this with event-driven invalidation using a ban list. When underlying data changes, origin services publish an invalidation event to Kafka. An Entity Cache consumer records an invalidation timestamp in Valkey for the affected entity and identifiers. On a cache hit, Entity Cache checks this entry. If the cached object was retrieved before the invalidation timestamp, it is treated as stale and refreshed from upstream. Rather than deleting cache keys, the system relies on timestamp comparison. Each cached object stores its retrieval time; invalidation simply records a newer timestamp. This design allows endpoints to maintain long soft TTLs for high hit rates while still achieving near real-time consistency, with P99 invalidation latency targeted at about one second.

3. Envoy-based outlier detection — automatic failover: Entity Cache integrates with our Envoy-based service mesh. As shown in Figure 3, Envoy monitors cache pod health and automatically ejects unhealthy pods from the load balancing pool. If all cache pods become unhealthy, Envoy routes traffic directly to upstream services, ensuring availability even during complete cache failures.

Figure 3: The service mesh sends normal traffic to healthy Entity Cache pods and ejects unhealthy pods from the load-balancing path. If the cache path is unavailable, traffic fails over entirely to the upstream service, preserving availability.

This automatic fallback design means Entity Cache adds resilience without introducing a new single point of failure. During onboarding, if a misconfiguration causes cache pods to crash, traffic automatically falls back to upstream. Teams can enable caching with confidence.

Scaling to millions of requests per second

Operating at millions of requests per second introduced system-level bottlenecks where small inefficiencies quickly amplified. Memory allocation, request coordination, and cache behavior all began to impact tail latency and upstream stability. To sustain performance, we focused on reducing contention, smoothing traffic patterns, and eliminating redundant work across hot paths.

  • Memory management at scale: Frequent allocations on hot paths increased garbage collection (GC) pressure and caused latency spikes. We implemented custom buffer pooling to reuse memory and minimize allocations. This reduced GC overhead, stabilized memory usage, and lowered P99 request overhead latency to around 2.1 ms while maintaining consistent throughput.
  • Cache stampede at scale: For hot entities, TTL-based expiration concentrated refresh traffic at a single point in time, creating spikes in upstream load. We implemented probabilistic early refresh based on the XFetch algorithm. As entries approach their soft TTL, each request has an increasing chance of triggering a refresh. This spreads traffic over time, reducing spikes and stabilizing upstream load.
  • Concurrency at million-request scale: Concurrent requests often duplicated the same work, especially for connection setup and cache misses on hot keys. We introduced a single flight pattern using atomic, lock-free structures. Compare and swap ensures only one goroutine performs a dial or fetch per key, while others reuse the result. Deduplication happens per pod without cross-pod coordination. This eliminated redundant work and reduced contention. Per-pod throughput increased roughly five-fold, allocation rates decreased by 50% to 60%, and P99 latency spikes were reduced by up to 80%.
  • Identifying what to cache: With thousands of endpoints, identifying strong caching candidates manually was not scalable. 

We built Cache Advisor to analyze real production traffic and guide onboarding. Running at ingress via Envoy’s external processing filter, it samples requests, tracks response stability, and estimates update frequency. It recommends TTL values and surfaces strong candidates. This identified over 130 onboarding opportunities, enabling broader and safer adoption of caching.

User/business impact

Entity Cache has become a core reliability layer at DoorDash, now serving over 1.5 million requests per second with 99.99999% availability. More than 100 endpoints across 50 services have been onboarded, delivering measurable improvements across latency, scalability, and failure resilience.

From a performance perspective, Entity Cache adds minimal overhead while delivering substantial gains:

  • P99 request overhead latency of approximately 2.1 ms
  • Cache hit rate consistently above 90%
  • 60% to 95% reduction in upstream requests during normal operation
  • Up to 90% latency reduction for newly onboarded endpoints
  • Even for services with local caches, end-to-end latency is often reduced by roughly half because of fewer cross-service network calls at client egress

Beyond performance, Entity Cache has materially strengthened platform reliability. During several production incidents, it prevented up to 90% of requests from reaching degraded upstream services. By serving stale but valid data when necessary, it has shielded services from upstream outages, eliminated stampede-driven amplification through probabilistic refresh, and reduced the blast radius of traffic spikes.

Continuous divergence monitoring enables safe adoption, giving teams confidence to enable caching without risking correctness. While infrastructure cost savings are a secondary effect, reduced upstream load also has lowered provisioning requirements and improved overall efficiency across the platform.

Next steps

  1. Dynamic traffic splitting based on error rate comparison: Today, traffic splitting between Entity Cache and upstream is based on static config. We are building dynamic traffic shifting that adjusts routing based on real-time error rate comparisons, sending more traffic upstream when cache health degrades, and shifting back as health improves.
  2. Noisy neighbor isolation per upstream cache cluster: Currently, all services share a single cache cluster. We’re moving toward dedicated cache clusters per high traffic service to provide hard resource boundaries, preventing issues in one service from impacting others.
  3. Adaptive concurrency limiting: Static concurrency limits are suboptimal, either wasting capacity during low load or causing latency spikes during high load. We’re implementing adaptive limiting that continuously measures system performance and automatically adjusts concurrency based on observed latency and throughput, maximizing capacity while maintaining latency targets.

Acknowledgements

Building Entity Cache was a collaborative effort across many teams at DoorDash. We would especially like to recognize the Core Infra team: Dakota Baber, Hochuen Wong, Yifan Yang, and Tejas Lodaya, whose contributions were invaluable to building, operating, and scaling the platform.

We are also grateful to Ivar Lazzaro, Muneeb Ansari, Karthik Katooru, Pushkar Raste, Matt Ranney, Thai Pham, Allen Meng, Madhav Gali, Jay Weinstein, Matt Zimmerman, and Sebastian Yates for their guidance, feedback, and support throughout the project.